 8
8peptides
spectra
0.000 | 0.012
0.000 | 0.000
0.000 | 0.002
0.616 | 0.681
0.056 | 0.130
0.000 | 0.000
0.231 | 0.263
0.000 | 0.000
1peptide
spectra
NA | NA
NA | NA
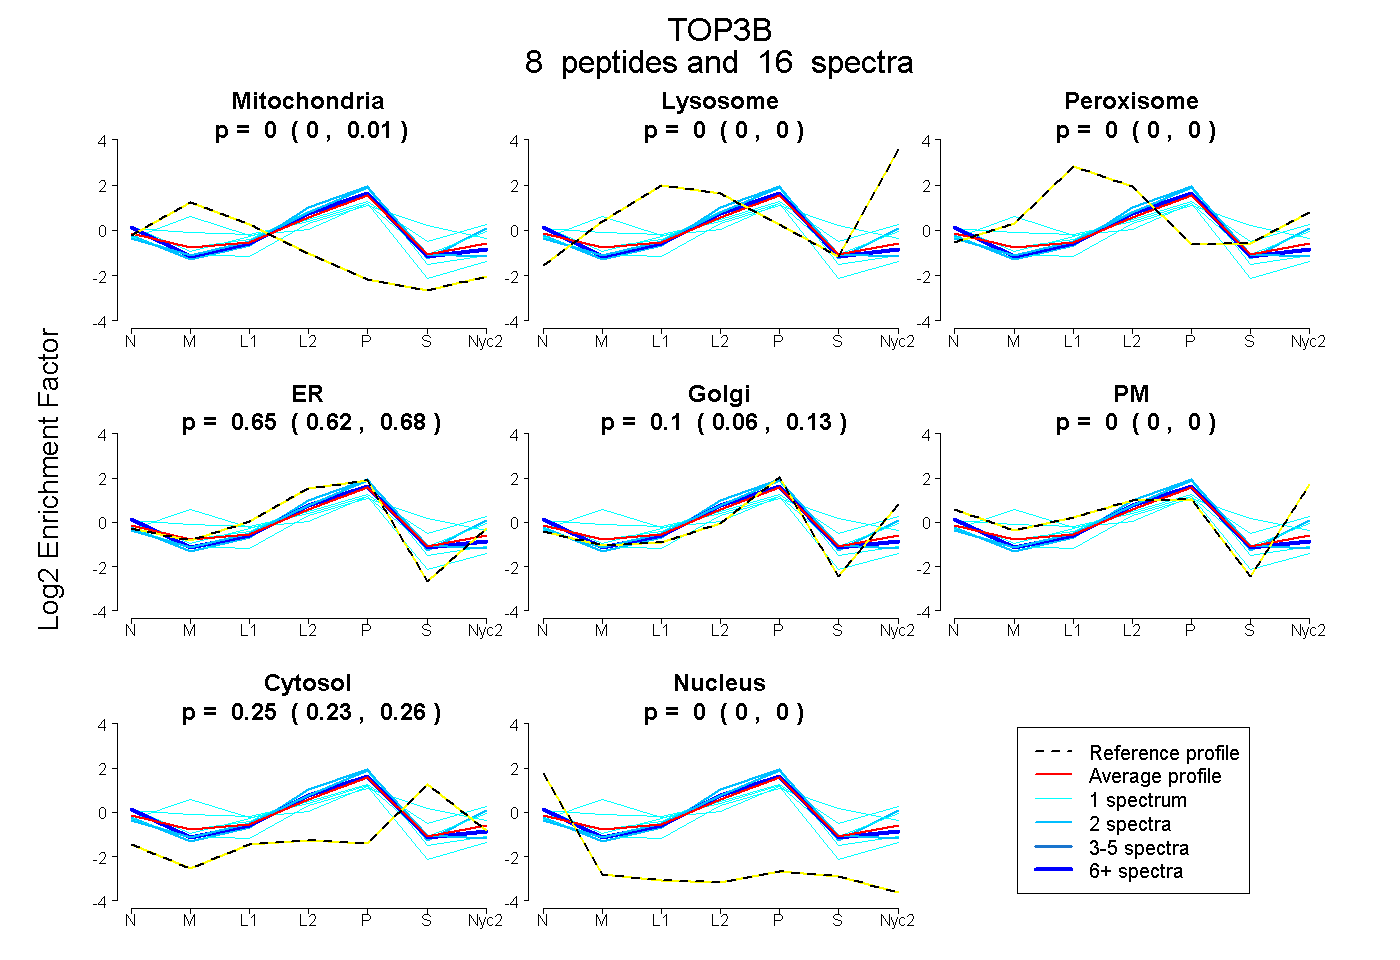
| Plot | Mito | Lyso | Perox | ER | Golgi | PM | Cytosol | Nucleus | |||||
| Expt A |
8 peptides |
16 spectra |
|
0.000 0.000 | 0.012 |
0.000 0.000 | 0.000 |
0.000 0.000 | 0.002 |
0.654 0.616 | 0.681 |
0.096 0.056 | 0.130 |
0.000 0.000 | 0.000 |
0.250 0.231 | 0.263 |
0.000 0.000 | 0.000 |
||
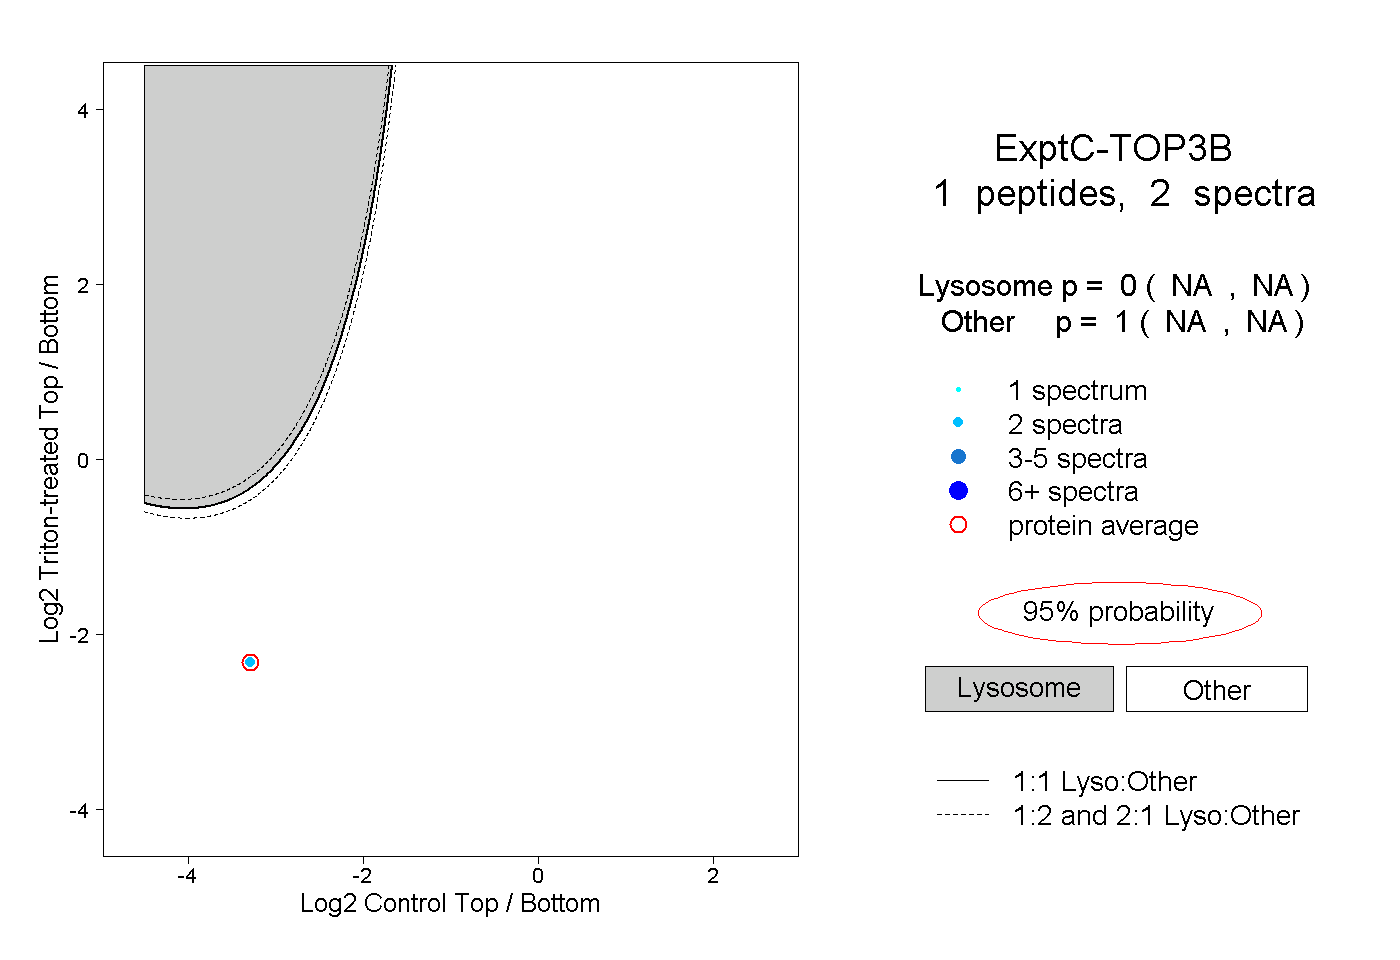
| Plot | Lyso | Other | |||||||||||
| Expt C |
1 peptide |
2 spectra |
|
0.000 NA | NA |
1.000 NA | NA |