13
13peptides
spectra
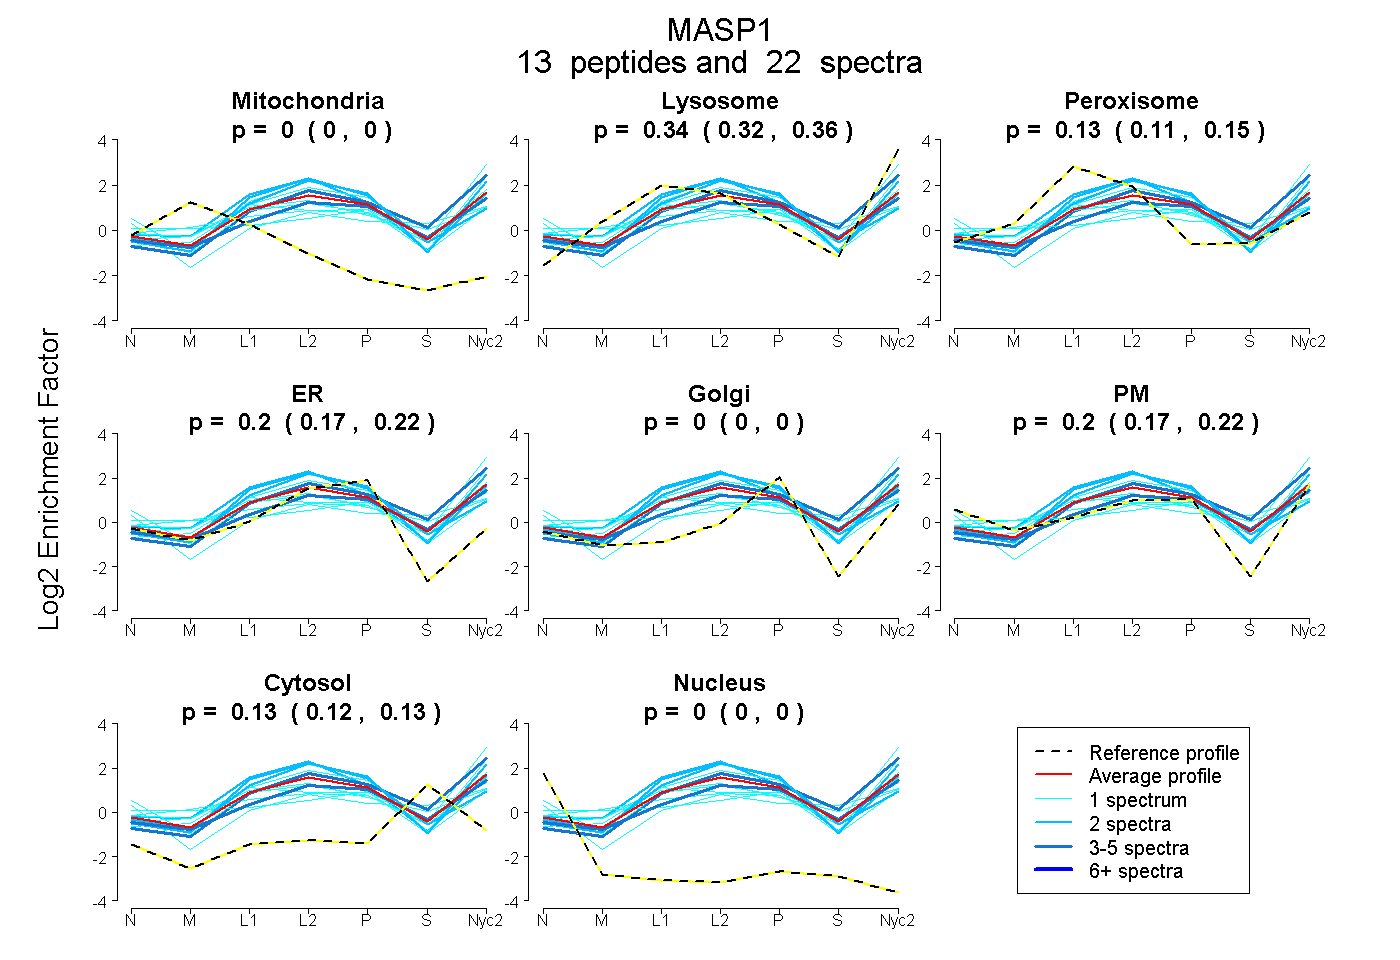
0.000 | 0.000
0.324 | 0.362
0.112 | 0.152
0.173 | 0.220
0.000 | 0.000
0.170 | 0.222
0.116 | 0.133
0.000 | 0.000
1peptide
spectrum
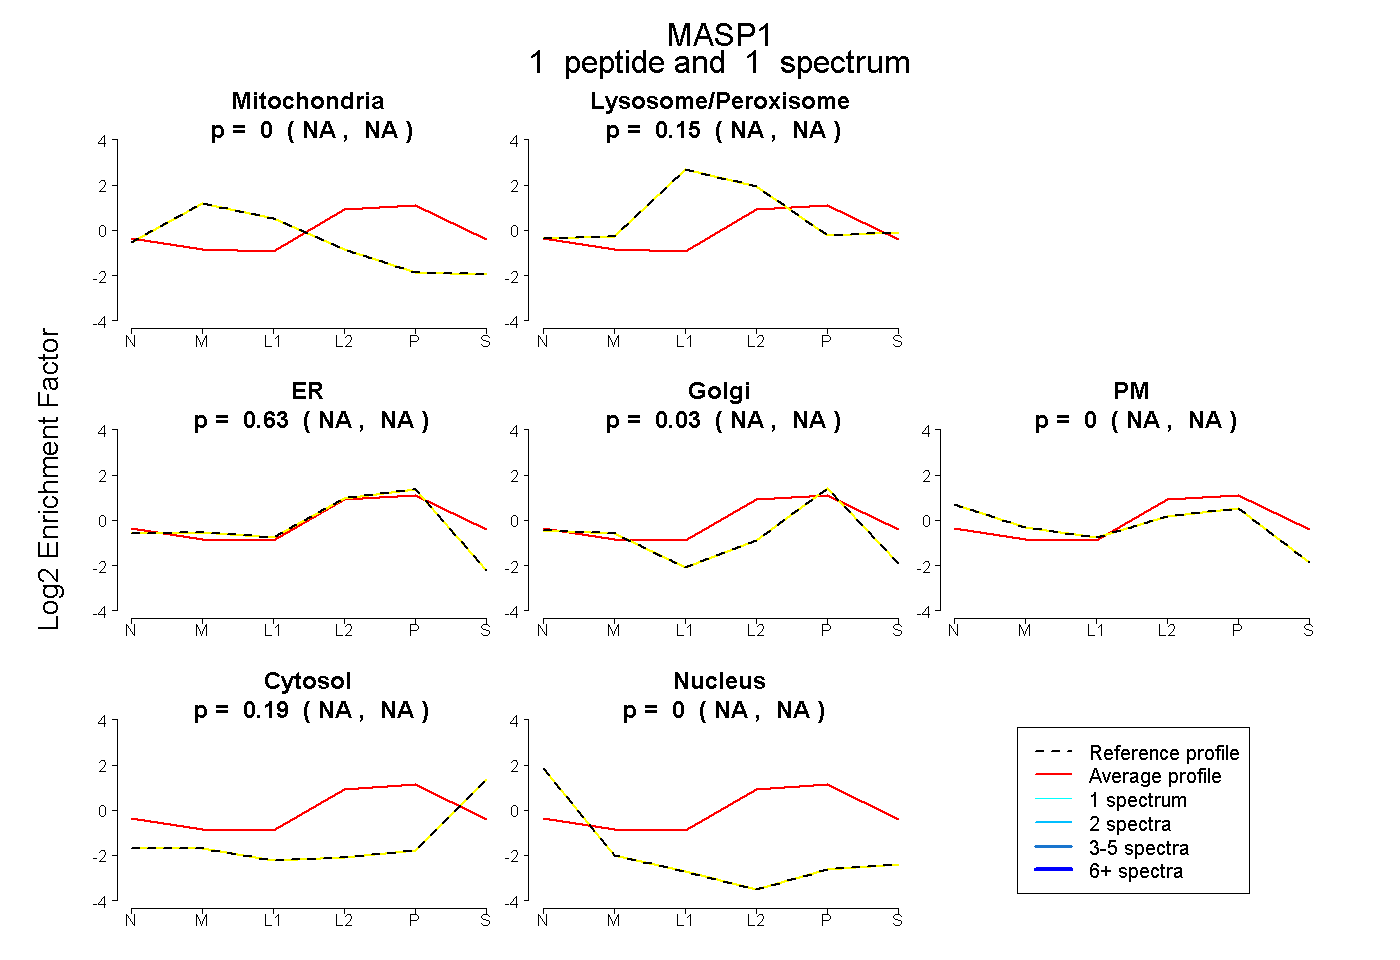
NA | NA
NA | NA
NA | NA
NA | NA
NA | NA
NA | NA
NA | NA
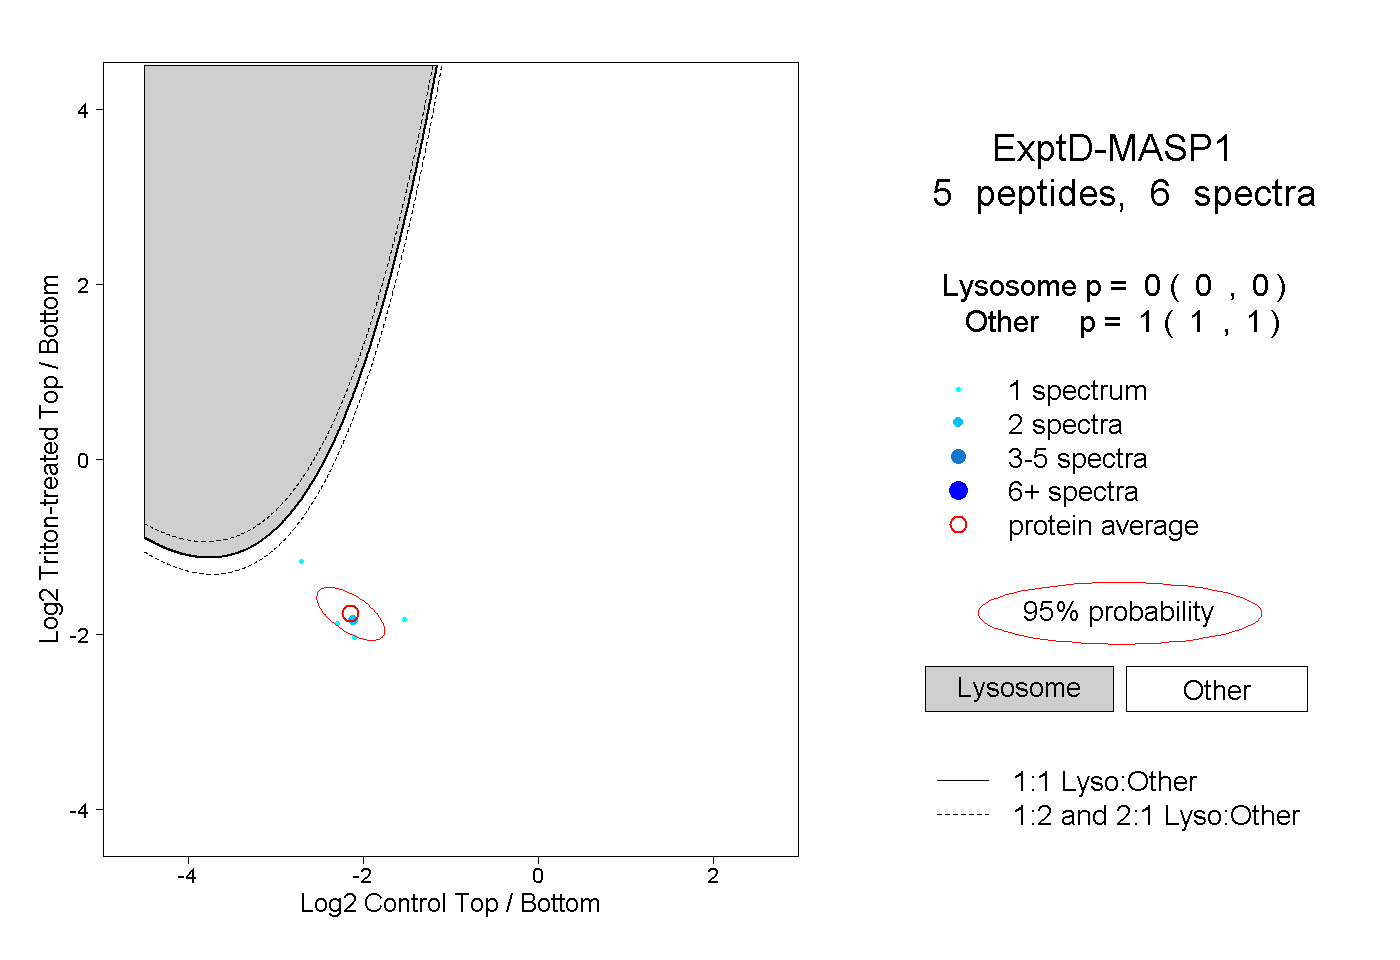
19peptides
spectra
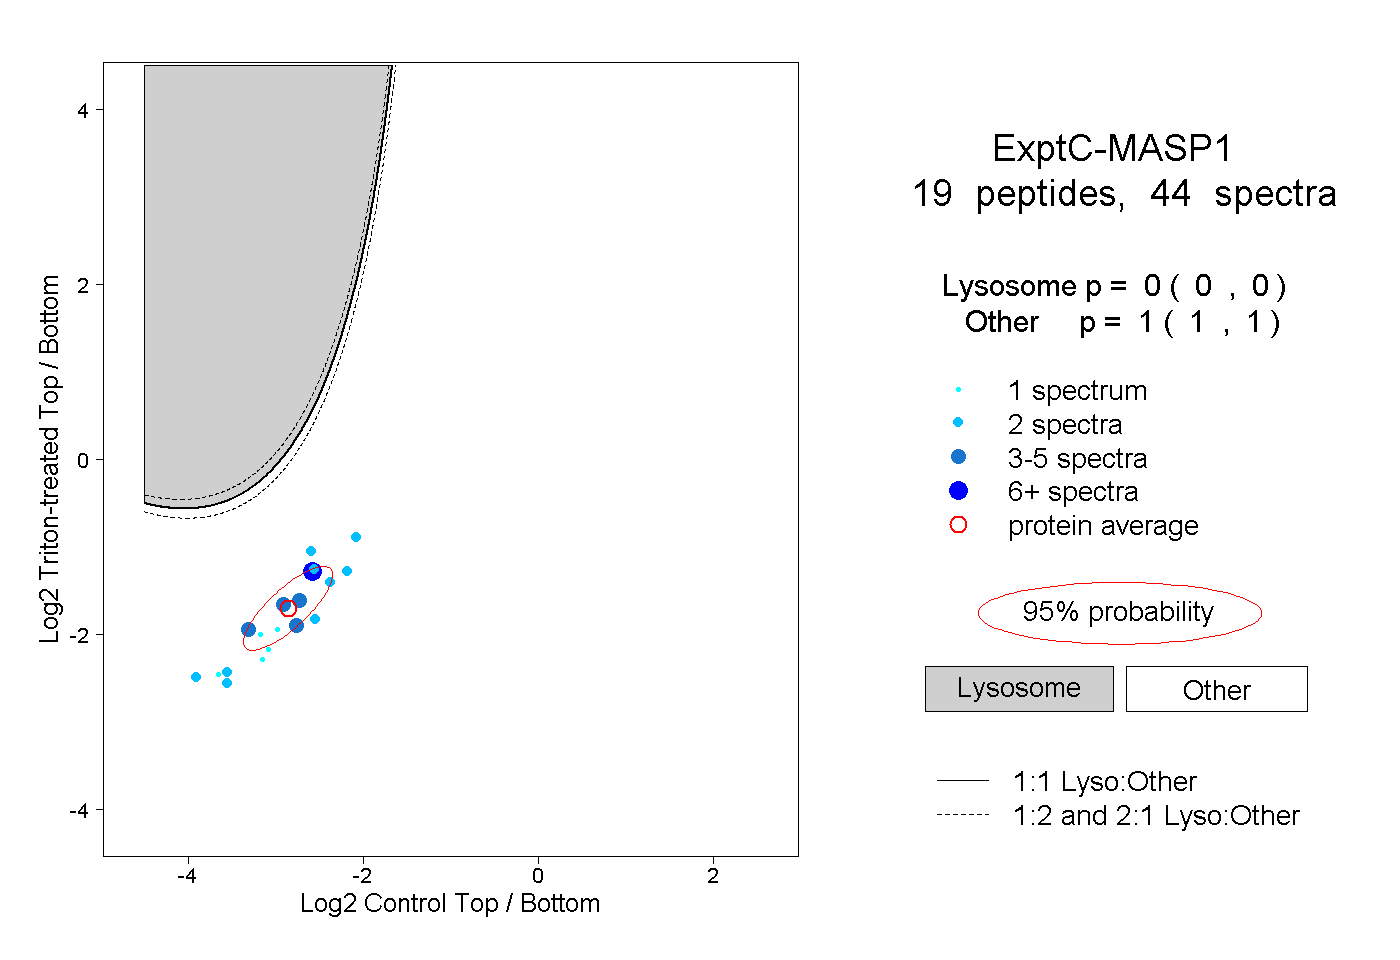
0.000 | 0.000
1.000 | 1.000