 13
13peptides
spectra
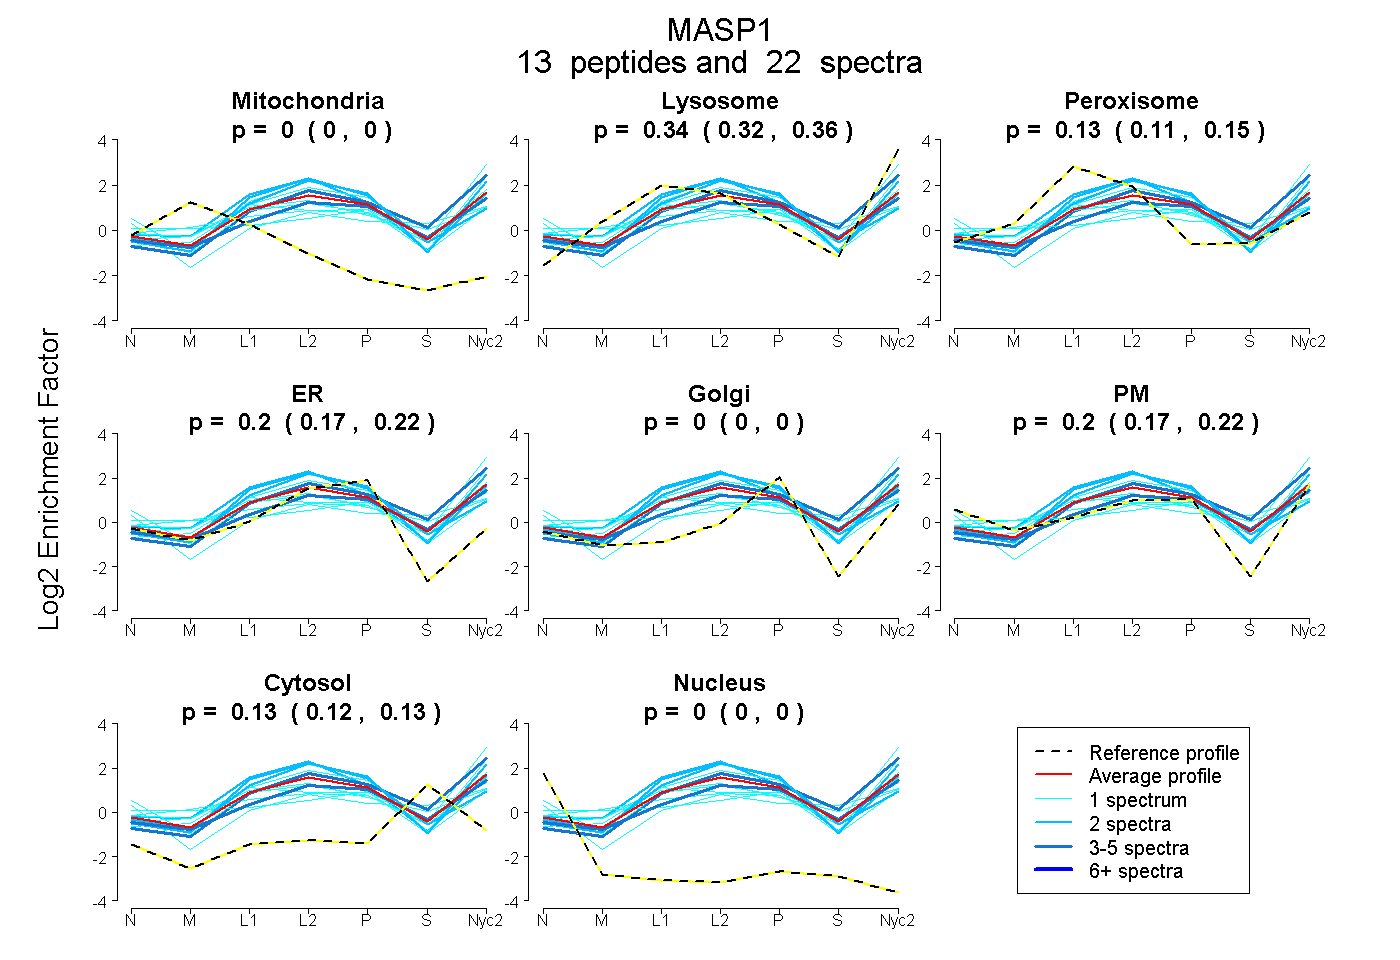
0.000 | 0.000
0.324 | 0.362
0.112 | 0.152
0.173 | 0.220
0.000 | 0.000
0.170 | 0.222
0.116 | 0.133
0.000 | 0.000
| Plot | Mito | Lyso | Perox | ER | Golgi | PM | Cytosol | Nucleus | |||||
| Expt A |
13 peptides |
22 spectra |
|
0.000 0.000 | 0.000 |
0.344 0.324 | 0.362 |
0.134 0.112 | 0.152 |
0.198 0.173 | 0.220 |
0.000 0.000 | 0.000 |
0.198 0.170 | 0.222 |
0.126 0.116 | 0.133 |
0.000 0.000 | 0.000 |
| 2 spectra, VETEDQVLATFCGR | 0.000 | 0.524 | 0.014 | 0.391 | 0.000 | 0.070 | 0.000 | 0.000 | ||
| 1 spectrum, IVDCGVPAVLK | 0.000 | 0.580 | 0.000 | 0.344 | 0.000 | 0.076 | 0.000 | 0.000 | ||
| 4 spectra, SDFSNEER | 0.000 | 0.623 | 0.000 | 0.194 | 0.000 | 0.000 | 0.183 | 0.000 | ||
| 1 spectrum, SPEPISTQSHSIQILFR | 0.000 | 0.129 | 0.202 | 0.000 | 0.000 | 0.526 | 0.143 | 0.000 | ||
| 1 spectrum, HGLVTFSTR | 0.000 | 0.241 | 0.175 | 0.000 | 0.066 | 0.371 | 0.147 | 0.000 | ||
| 1 spectrum, DACAGDSGGPMVTK | 0.000 | 0.039 | 0.147 | 0.000 | 0.000 | 0.433 | 0.381 | 0.000 | ||
| 1 spectrum, DNTVIPVSK | 0.000 | 0.170 | 0.364 | 0.000 | 0.207 | 0.147 | 0.112 | 0.000 | ||
| 1 spectrum, DGAWSNK | 0.000 | 0.690 | 0.000 | 0.114 | 0.087 | 0.077 | 0.032 | 0.000 | ||
| 2 spectra, ALPNLVK | 0.000 | 0.328 | 0.296 | 0.315 | 0.000 | 0.061 | 0.000 | 0.000 | ||
| 4 spectra, VWGPFCGEK | 0.000 | 0.361 | 0.012 | 0.251 | 0.000 | 0.152 | 0.225 | 0.000 | ||
| 1 spectrum, SLPTCLPVCGLPK | 0.003 | 0.016 | 0.246 | 0.000 | 0.249 | 0.370 | 0.116 | 0.000 | ||
| 2 spectra, VECSGNLFTQR | 0.000 | 0.198 | 0.330 | 0.446 | 0.000 | 0.000 | 0.026 | 0.000 | ||
| 1 spectrum, DQVLISCDTGYK | 0.000 | 0.176 | 0.412 | 0.090 | 0.112 | 0.039 | 0.171 | 0.000 |
| Plot | Mito | Lyso or Perox | ER | Golgi | PM | Cytosol | Nucleus | ||||||
| Expt B |
1 peptide |
1 spectrum |
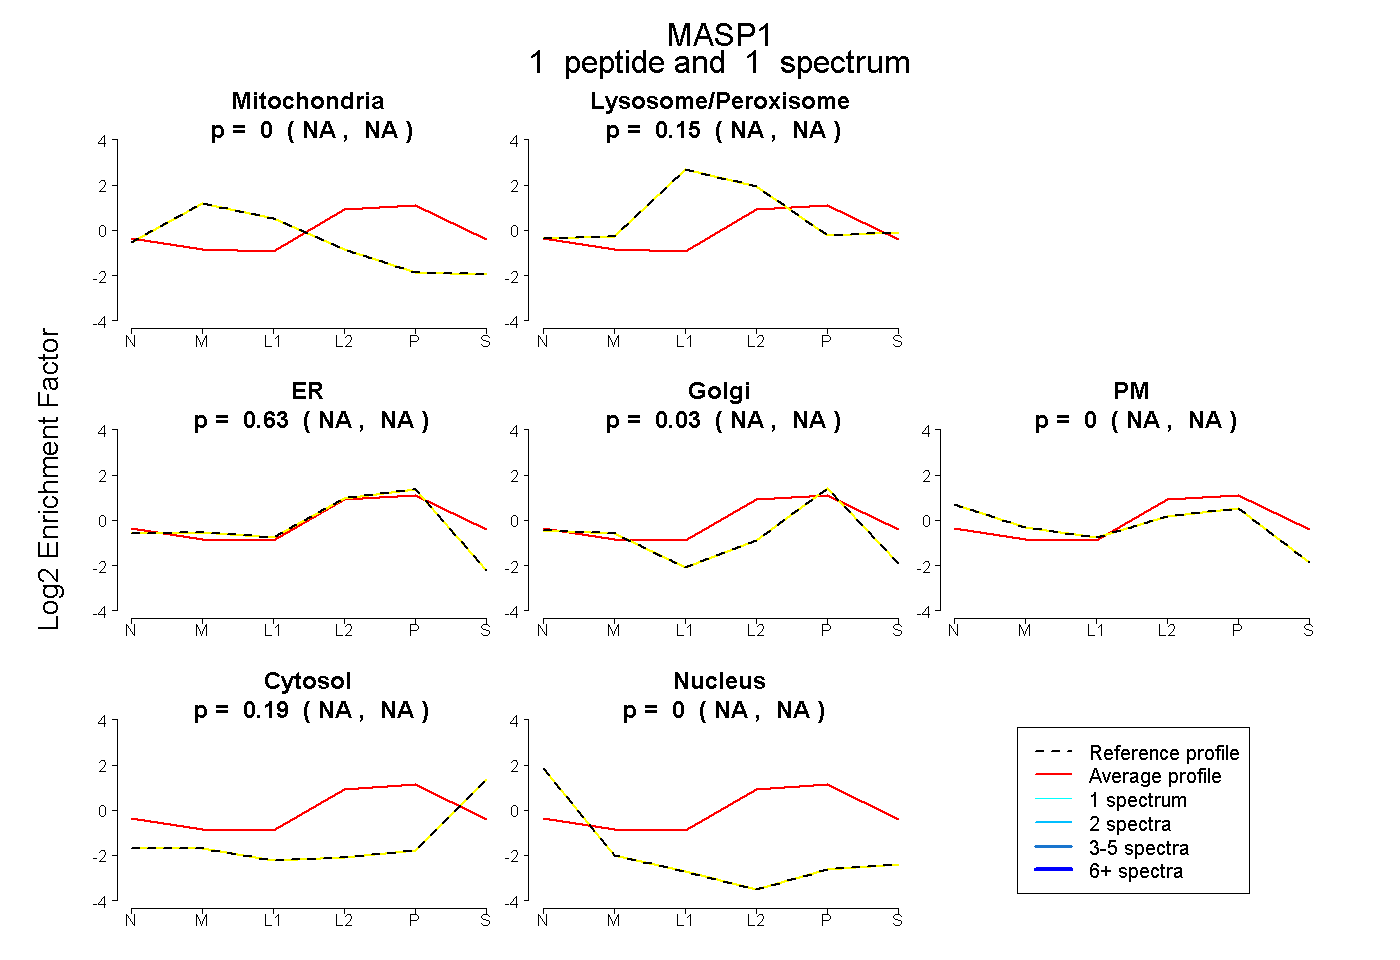 |
0.000 NA | NA |
0.150 NA | NA |
0.632 NA | NA |
0.030 NA | NA |
0.000 NA | NA |
0.188 NA | NA |
0.000 NA | NA |
|||
| Plot | Lyso | Other | |||||||||||
| Expt C |
19 peptides |
44 spectra |
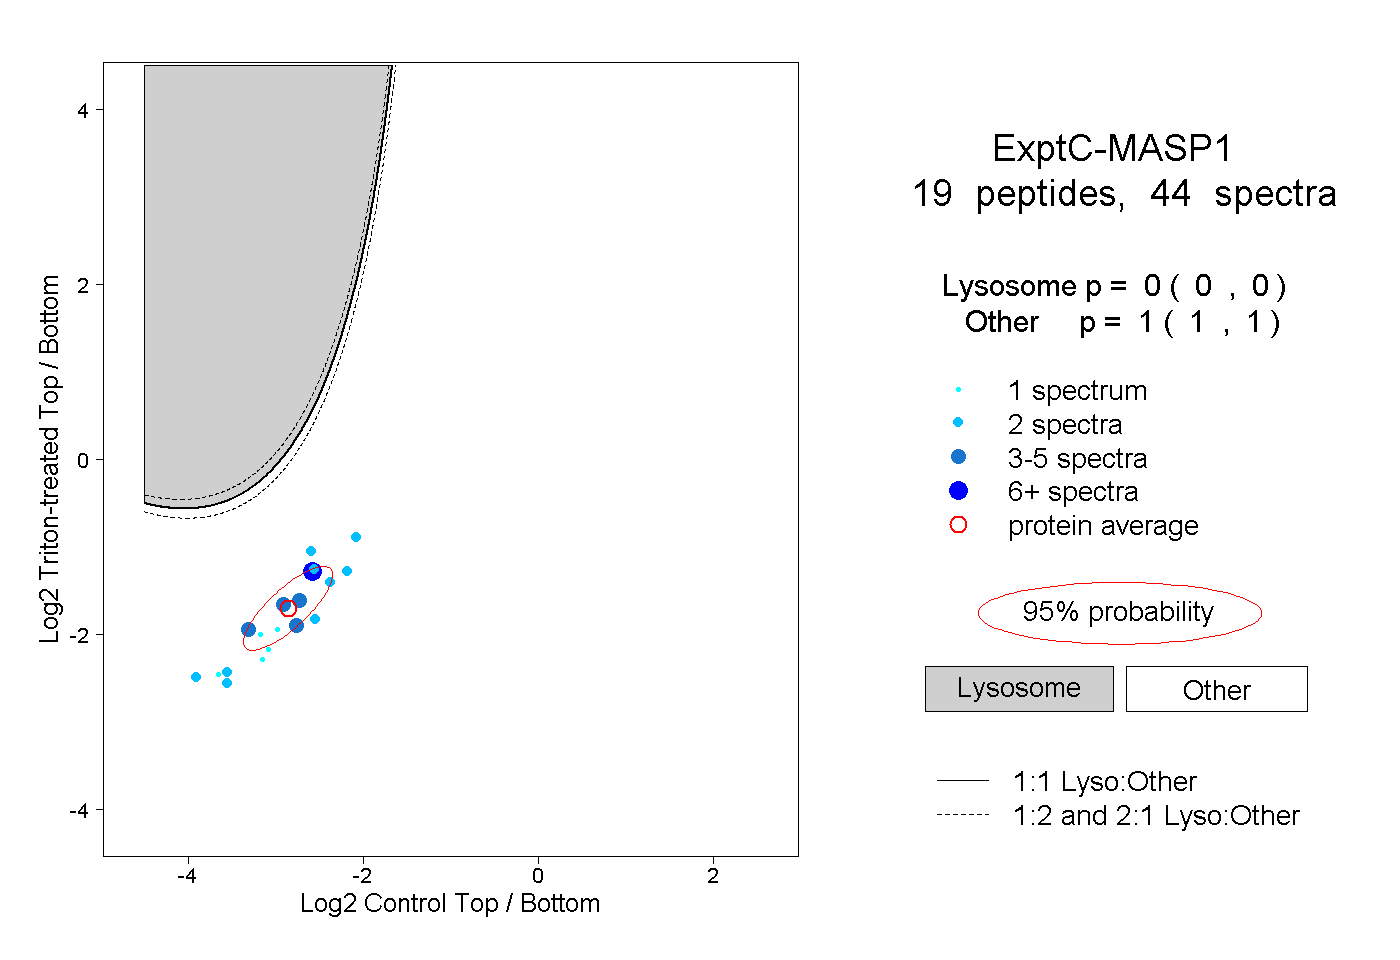 |
0.000 0.000 | 0.000 |
1.000 1.000 | 1.000 |
||||||||
| Plot | Lyso | Other | |||||||||||
| Expt D |
5 peptides |
6 spectra |
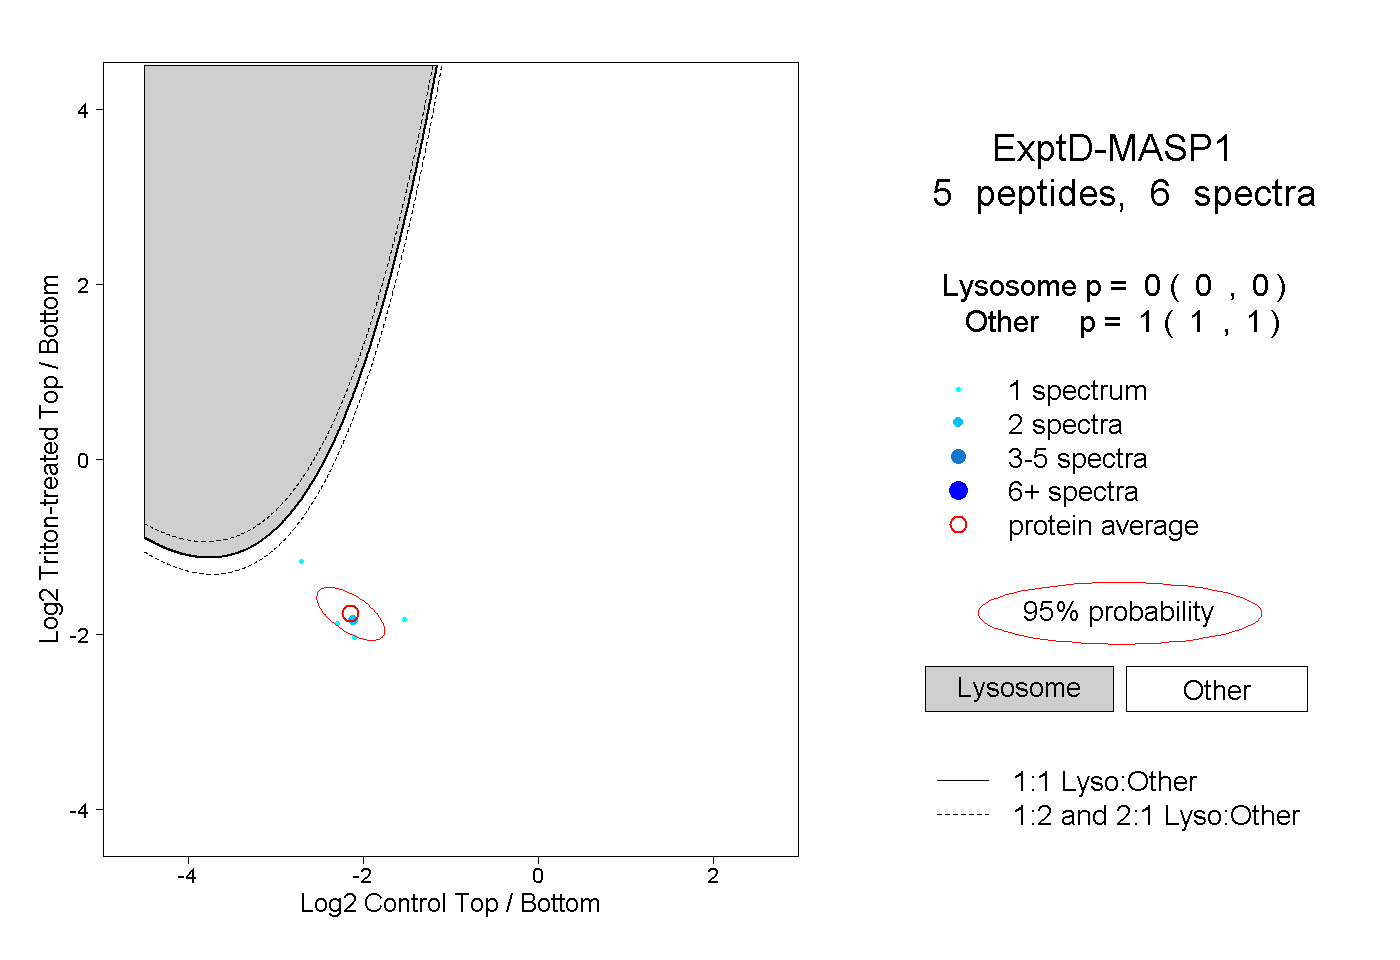 |
0.000 0.000 | 0.000 |
1.000 1.000 | 1.000 |