 9
9peptides
spectra
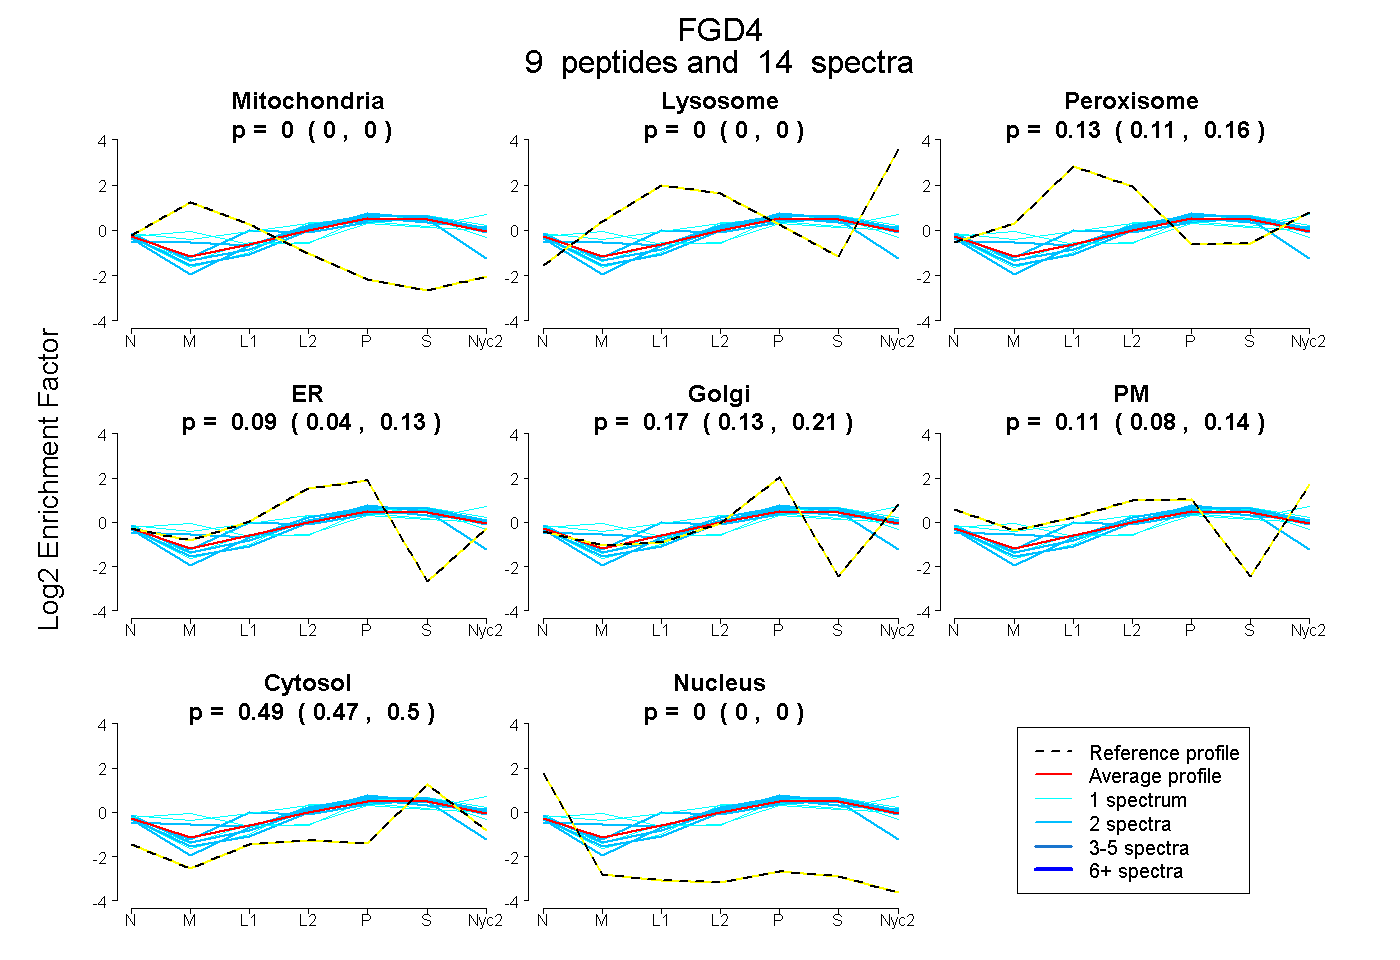
0.000 | 0.000
0.000 | 0.000
0.108 | 0.156
0.040 | 0.128
0.128 | 0.211
0.079 | 0.143
0.475 | 0.504
0.000 | 0.000
1peptide
spectrum
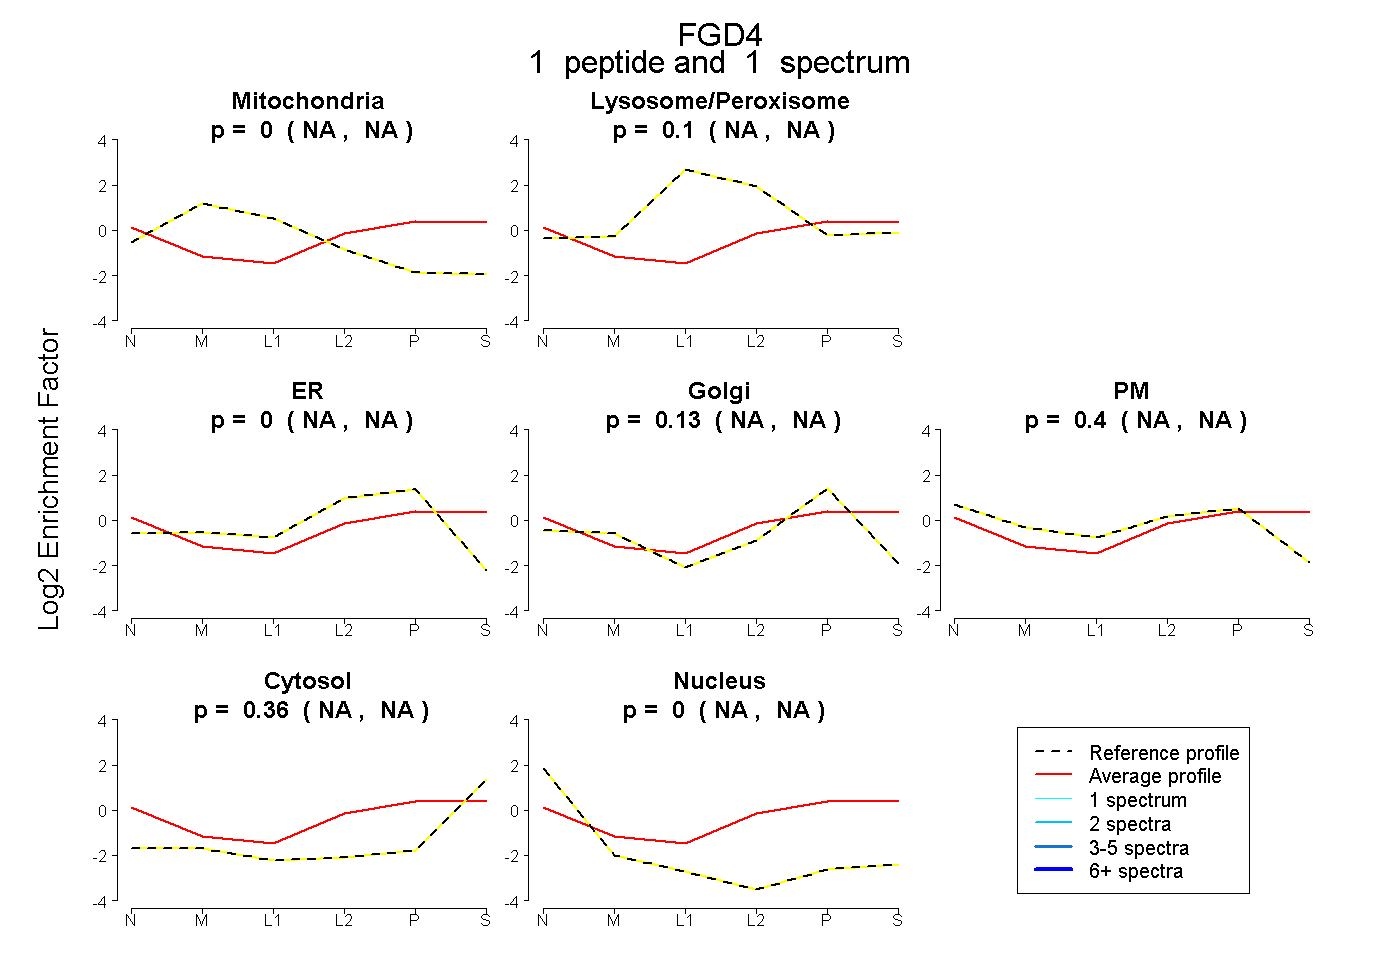
NA | NA
NA | NA
NA | NA
NA | NA
NA | NA
NA | NA
NA | NA
14peptides
spectra
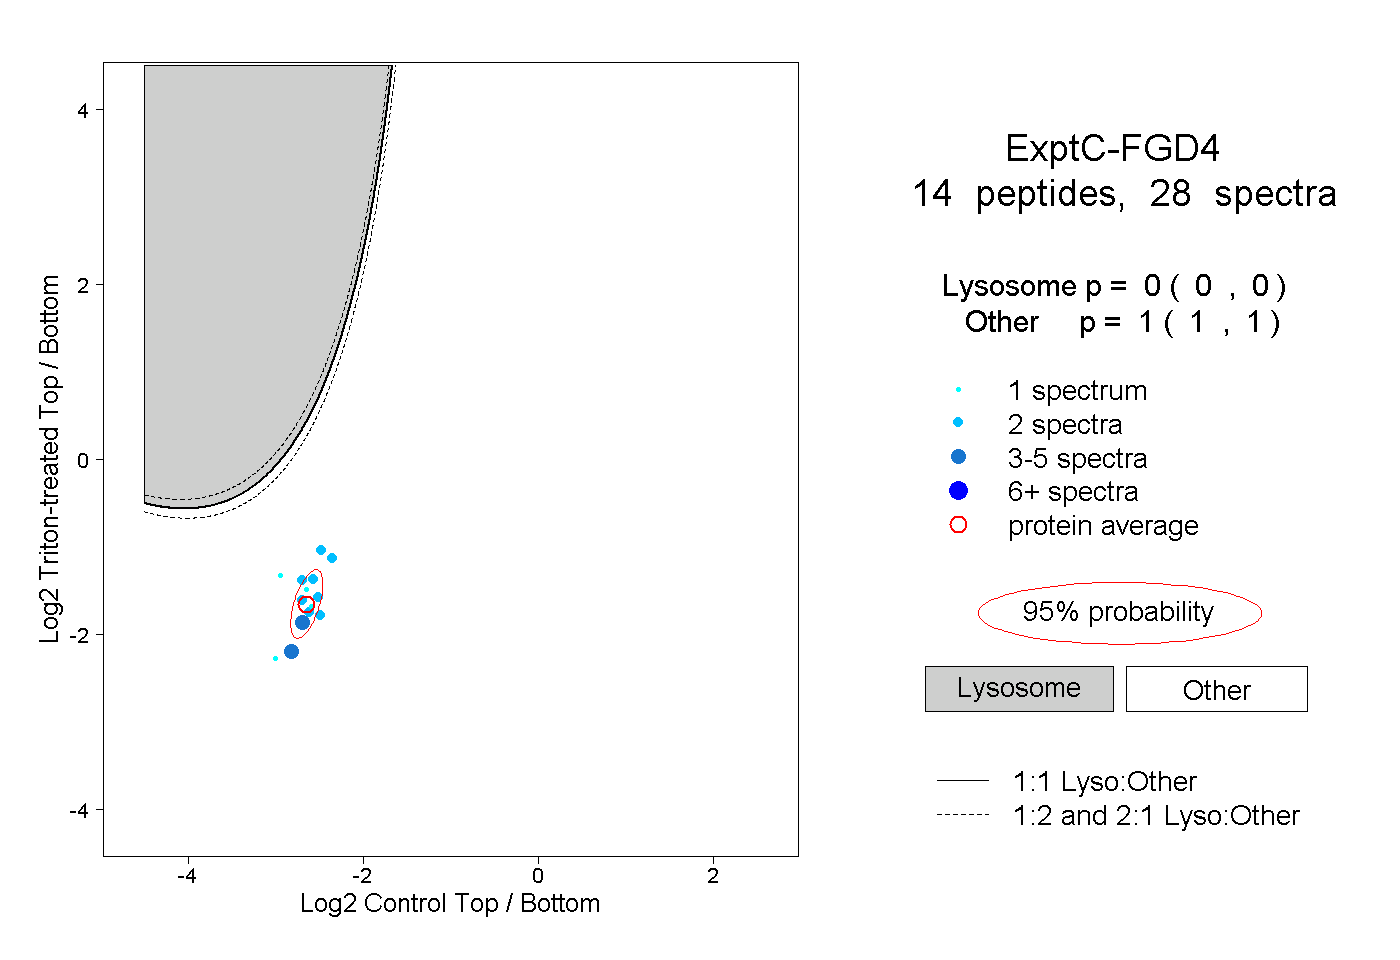
0.000 | 0.000
1.000 | 1.000
3peptides
spectra
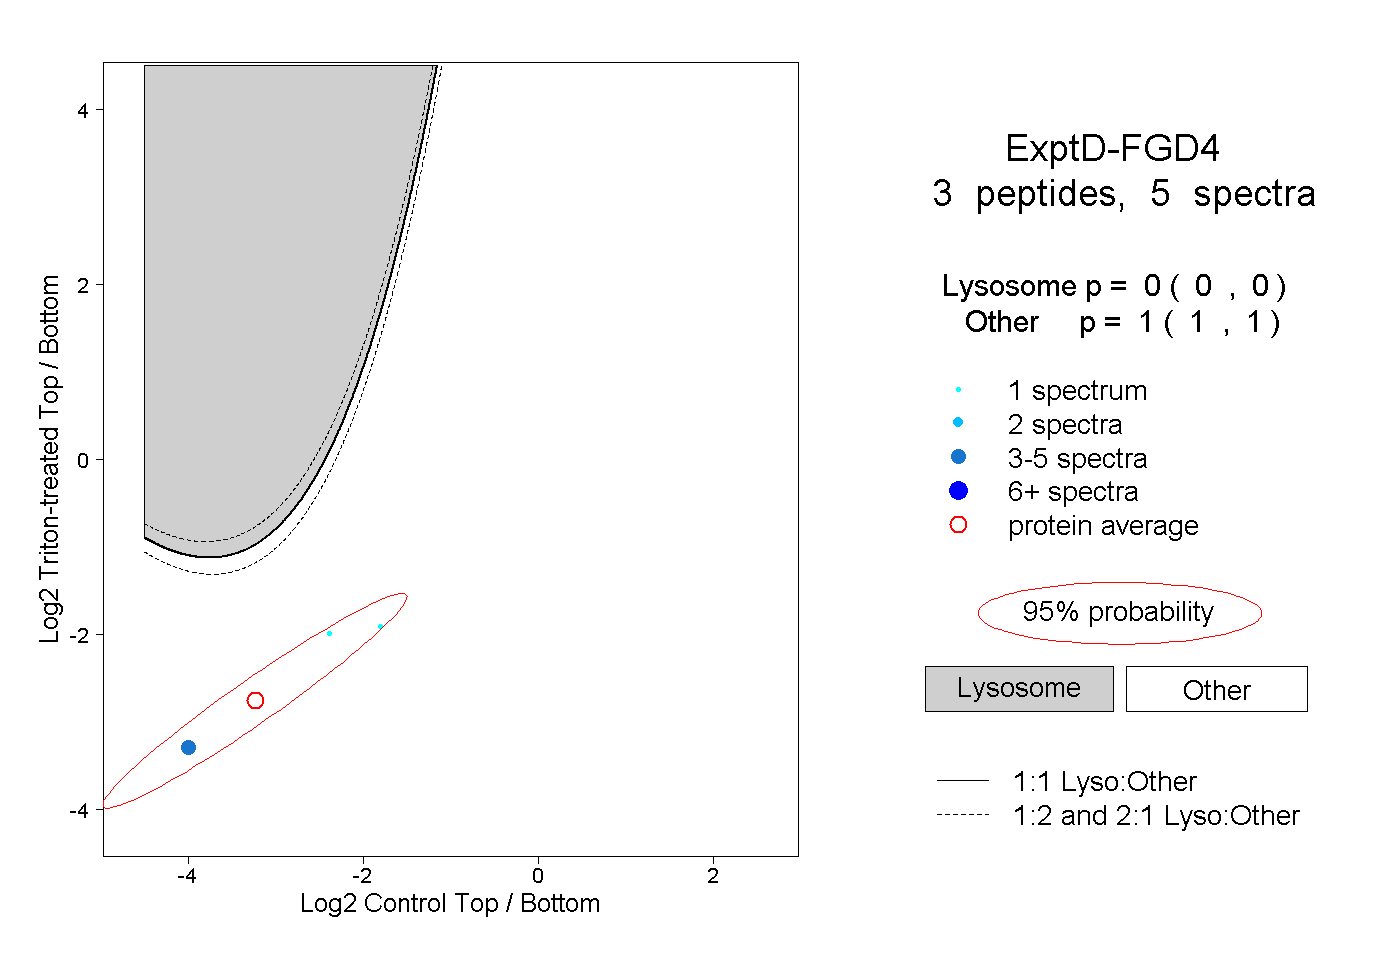
0.000 | 0.000
1.000 | 1.000