 5
5peptides
spectra
0.000 | 0.000
0.000 | 0.000
0.000 | 0.000
0.157 | 0.217
0.000 | 0.028
0.000 | 0.000
0.143 | 0.178
0.616 | 0.655
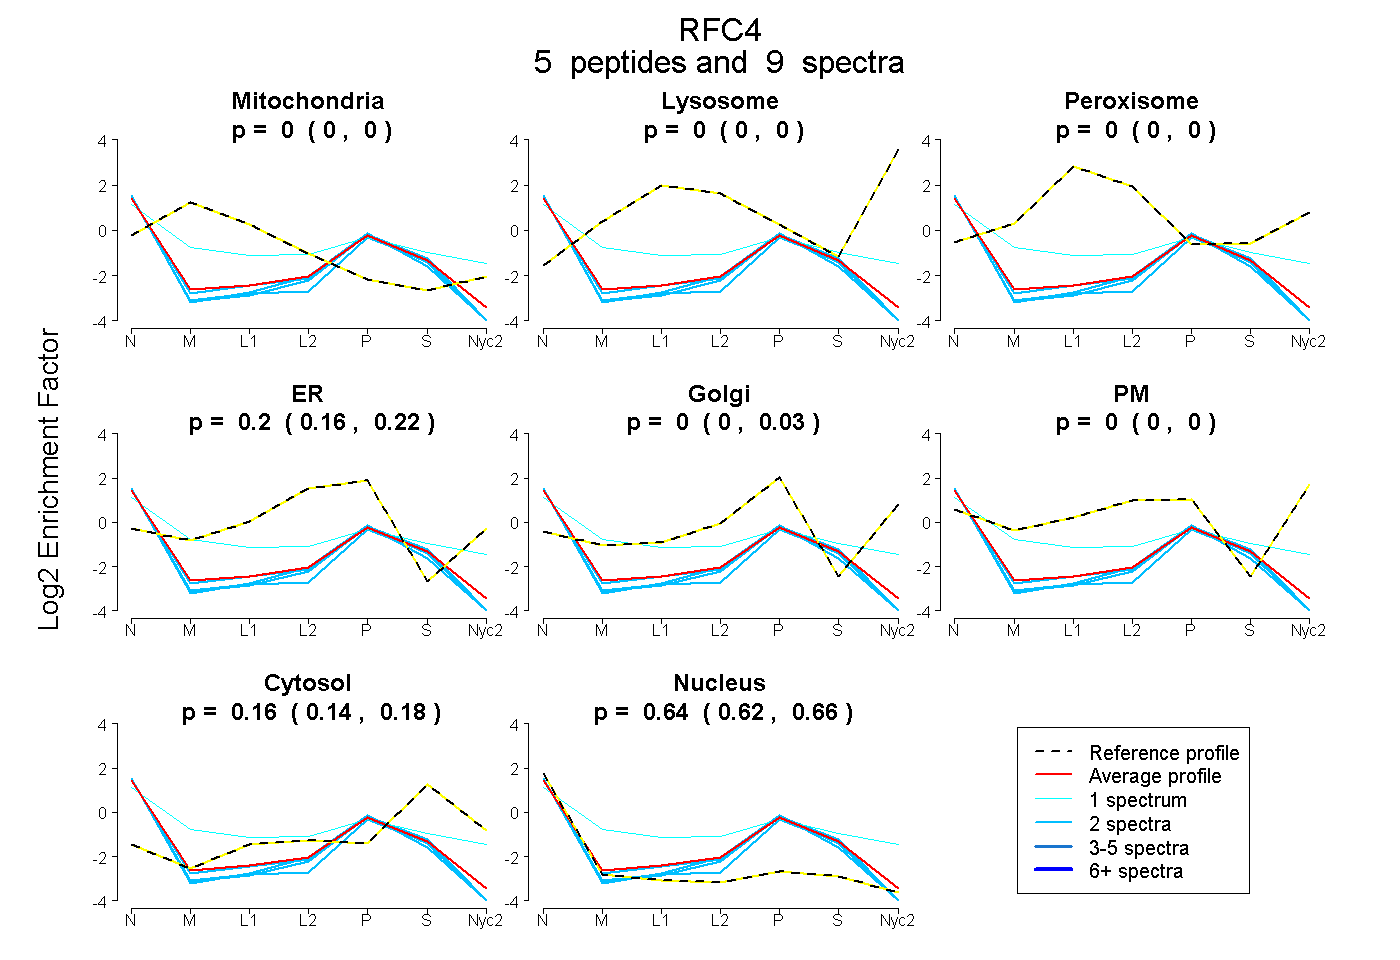
| Plot | Mito | Lyso | Perox | ER | Golgi | PM | Cytosol | Nucleus | |||||
| Expt A |
5 peptides |
9 spectra |
|
0.000 0.000 | 0.000 |
0.000 0.000 | 0.000 |
0.000 0.000 | 0.000 |
0.200 0.157 | 0.217 |
0.000 0.000 | 0.028 |
0.000 0.000 | 0.000 |
0.163 0.143 | 0.178 |
0.637 0.616 | 0.655 |
| 2 spectra, ELFGPELFR | 0.000 | 0.000 | 0.000 | 0.143 | 0.000 | 0.000 | 0.134 | 0.724 | ||
| 1 spectrum, SDGKPCPPFK | 0.127 | 0.000 | 0.017 | 0.097 | 0.000 | 0.248 | 0.221 | 0.289 | ||
| 2 spectra, IGDEEIAYLVR | 0.000 | 0.000 | 0.000 | 0.095 | 0.000 | 0.000 | 0.158 | 0.747 | ||
| 2 spectra, IIEPLTSR | 0.000 | 0.000 | 0.000 | 0.171 | 0.000 | 0.000 | 0.152 | 0.677 | ||
| 2 spectra, AITFLQSATR | 0.000 | 0.000 | 0.000 | 0.179 | 0.000 | 0.000 | 0.094 | 0.727 |
| Plot | Mito | Lyso or Perox | ER | Golgi | PM | Cytosol | Nucleus | ||||||
| Expt B |
1 peptide |
1 spectrum |
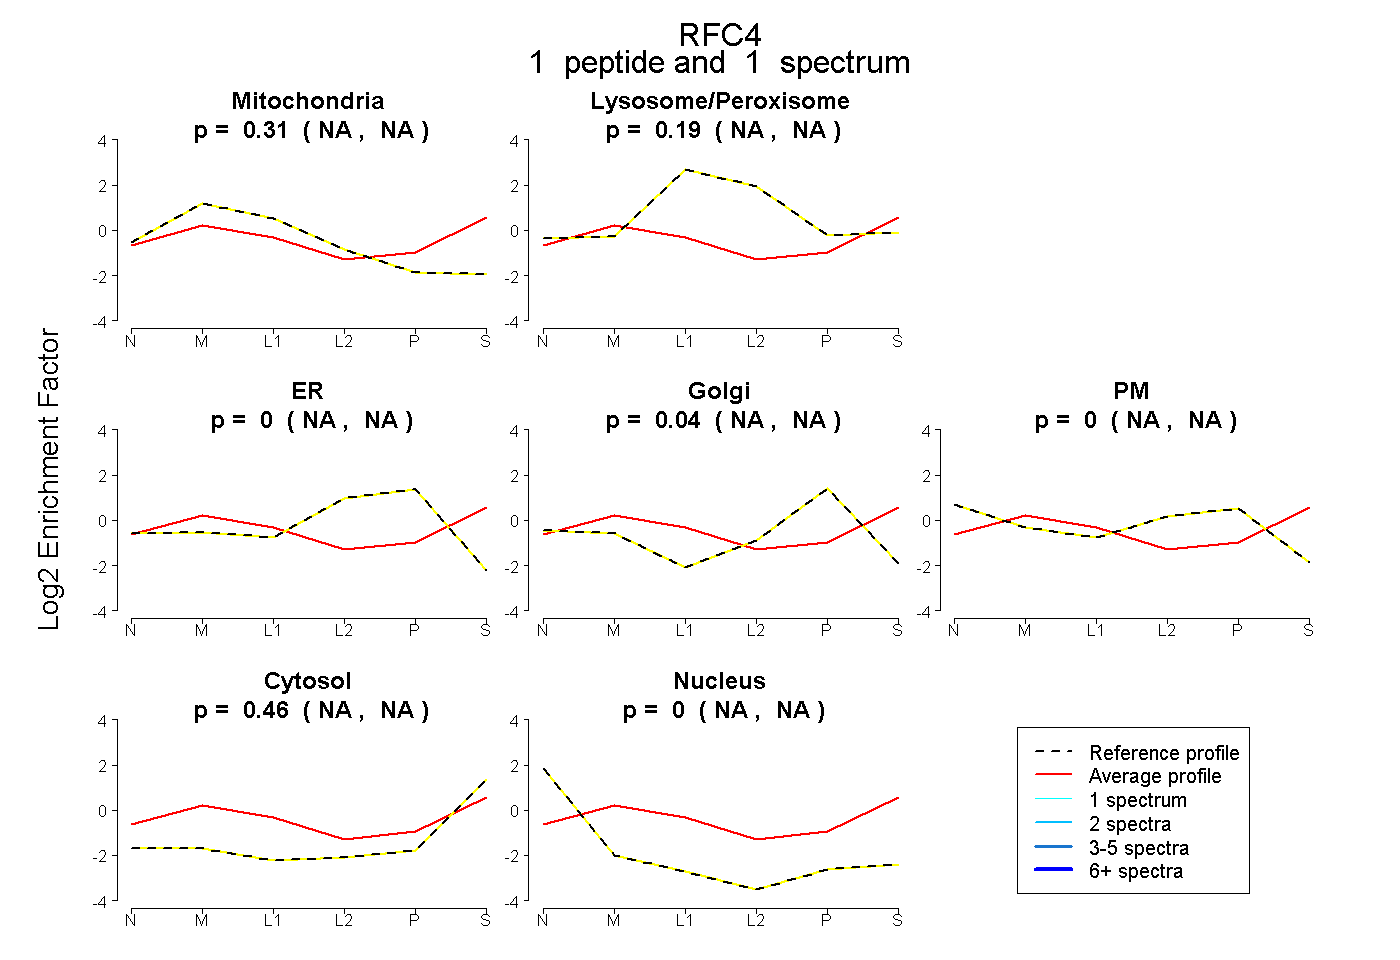 |
0.313 NA | NA |
0.193 NA | NA |
0.000 NA | NA |
0.036 NA | NA |
0.000 NA | NA |
0.458 NA | NA |
0.000 NA | NA |