6
6peptides
spectra
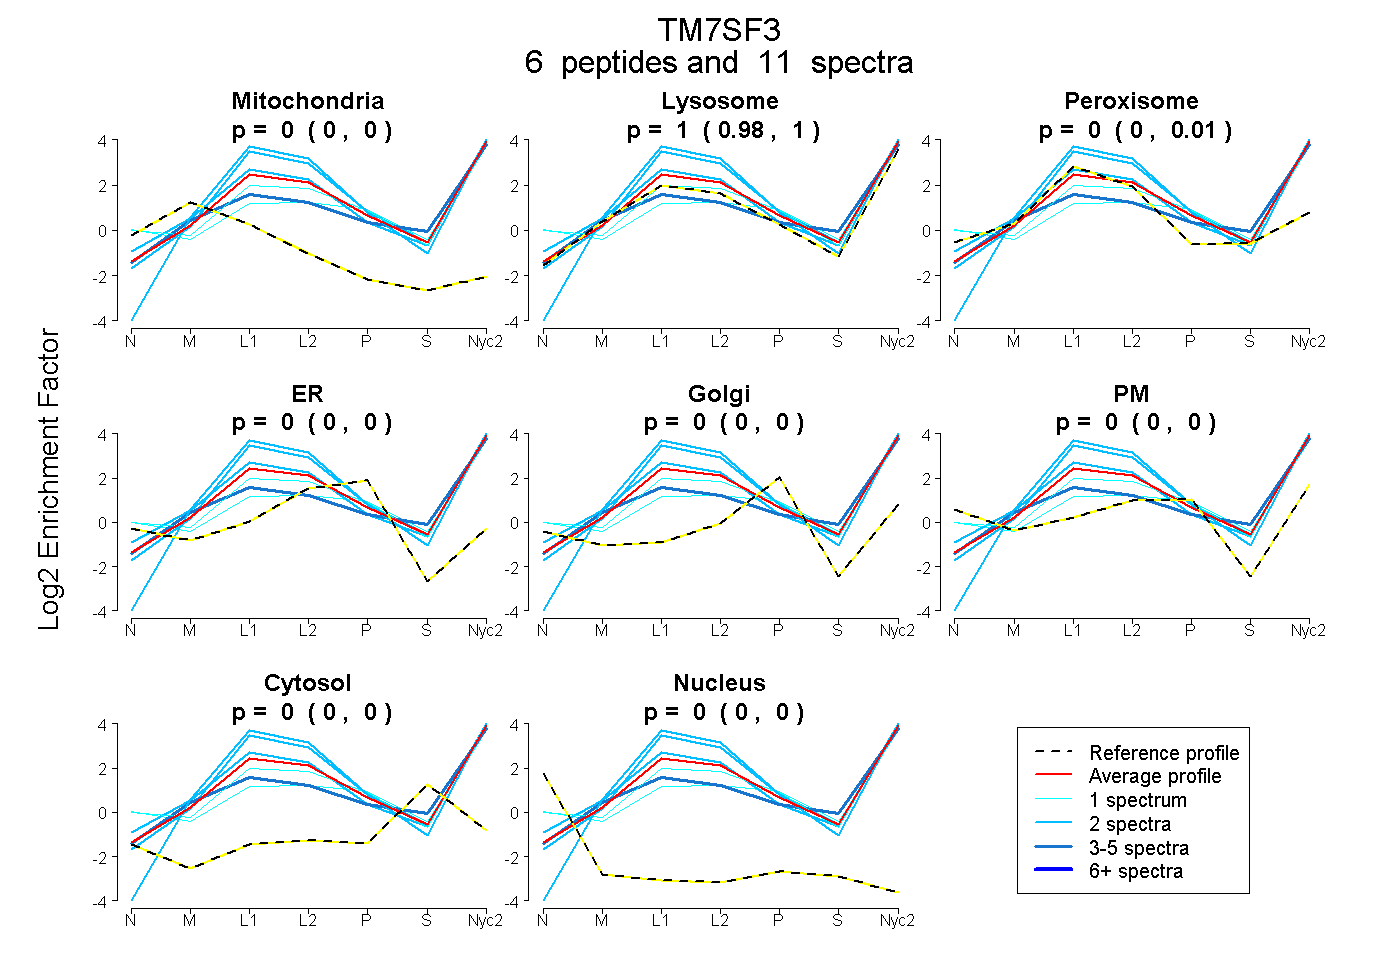
0.000 | 0.000
0.982 | 1.000
0.000 | 0.010
0.000 | 0.000
0.000 | 0.000
0.000 | 0.000
0.000 | 0.000
0.000 | 0.000
2peptides
spectra
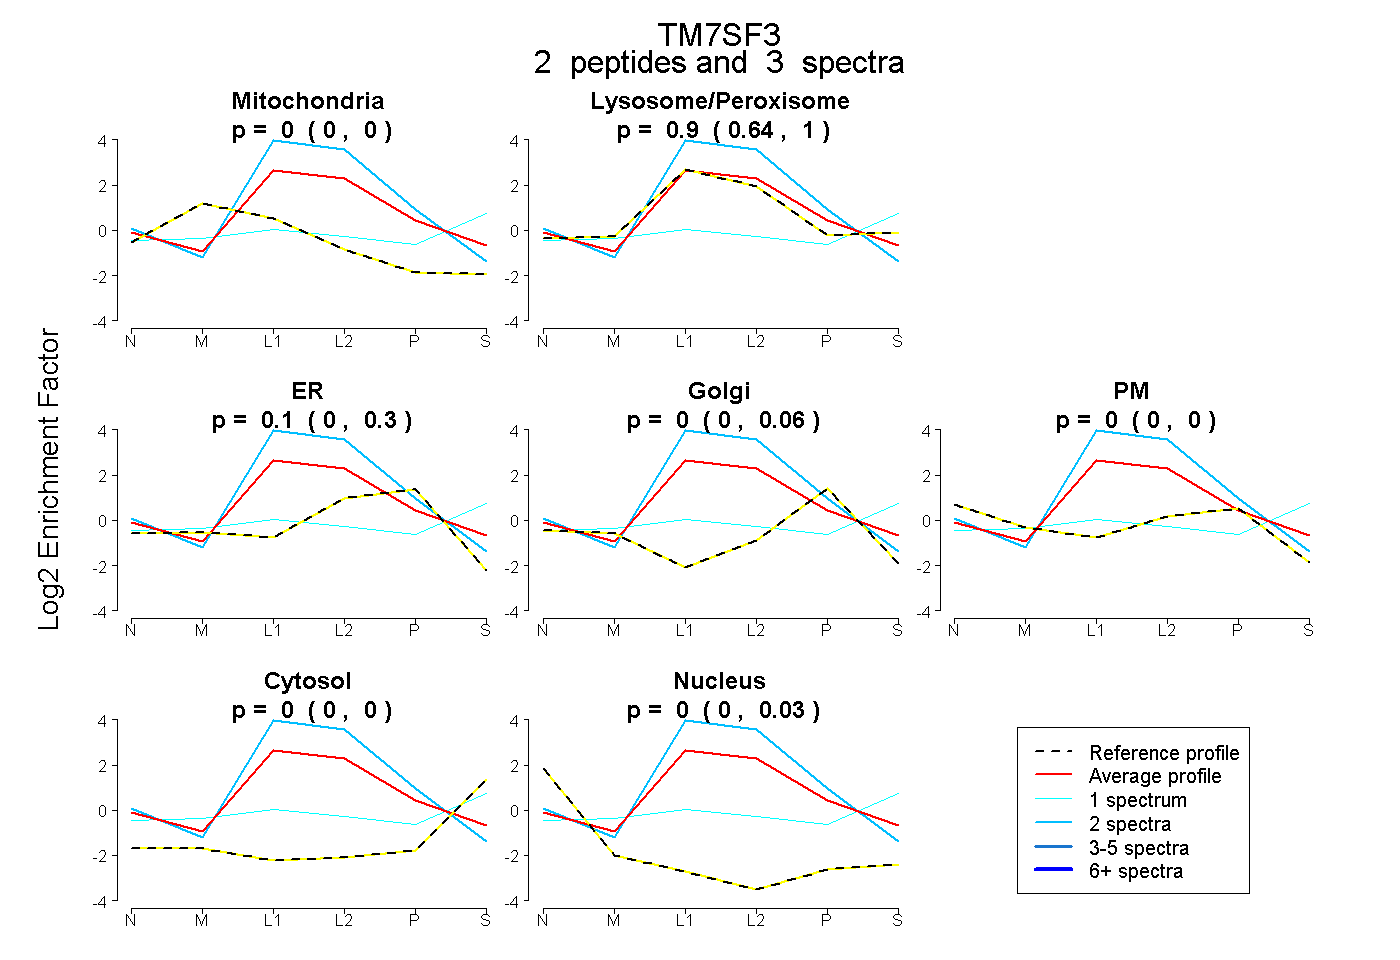
0.000 | 0.000
0.636 | 1.000
0.000 | 0.298
0.000 | 0.058
0.000 | 0.000
0.000 | 0.000
0.000 | 0.030
11peptides
spectra
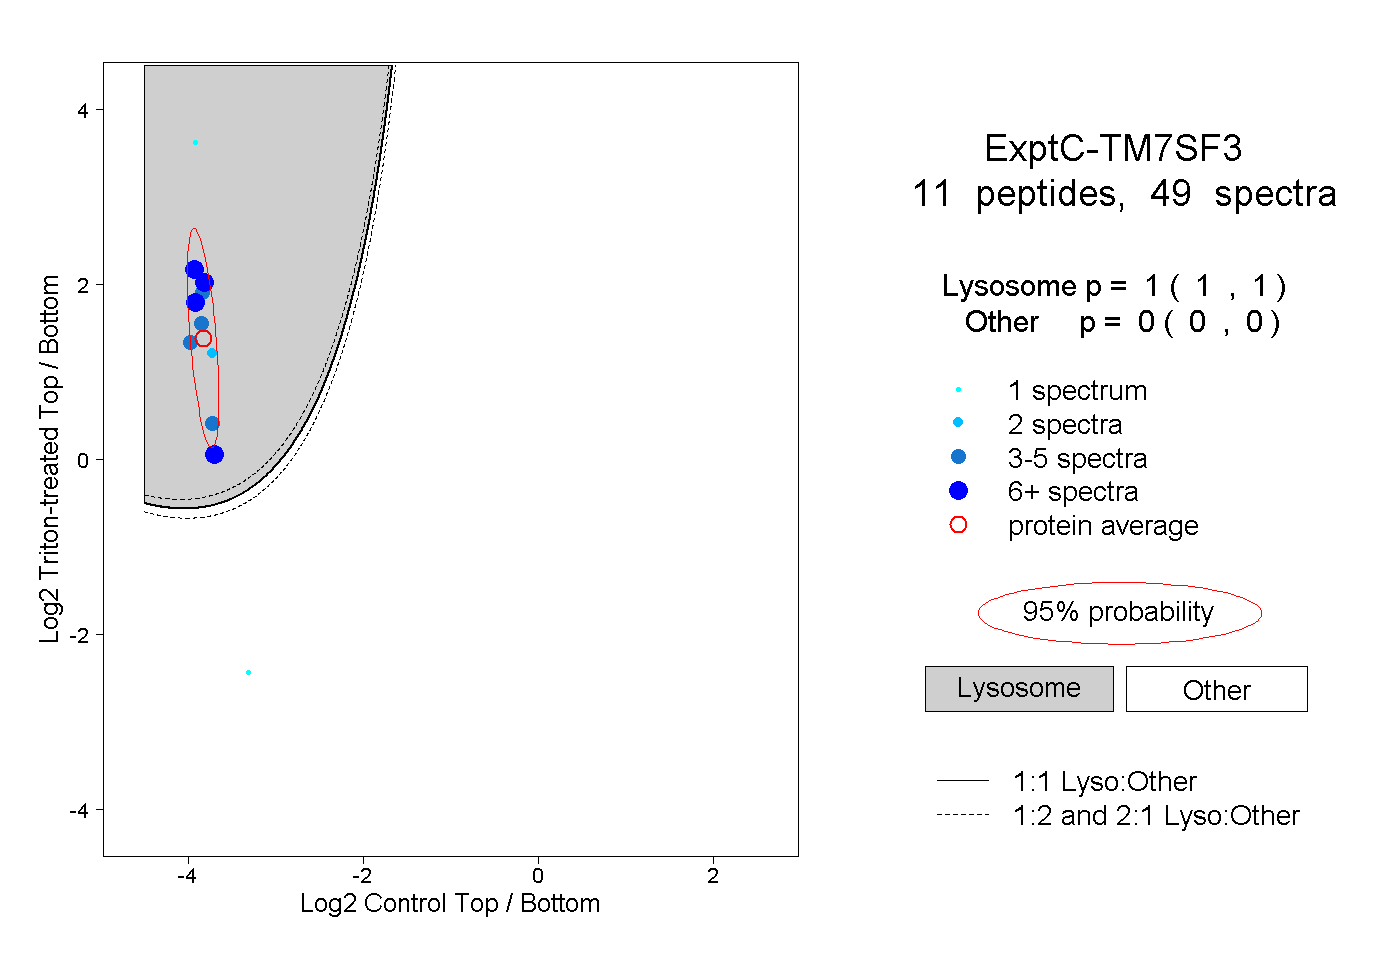
1.000 | 1.000
0.000 | 0.000