 6
6peptides
spectra
0.000 | 0.000
0.982 | 1.000
0.000 | 0.010
0.000 | 0.000
0.000 | 0.000
0.000 | 0.000
0.000 | 0.000
0.000 | 0.000
| Plot | Mito | Lyso | Perox | ER | Golgi | PM | Cytosol | Nucleus | |||||
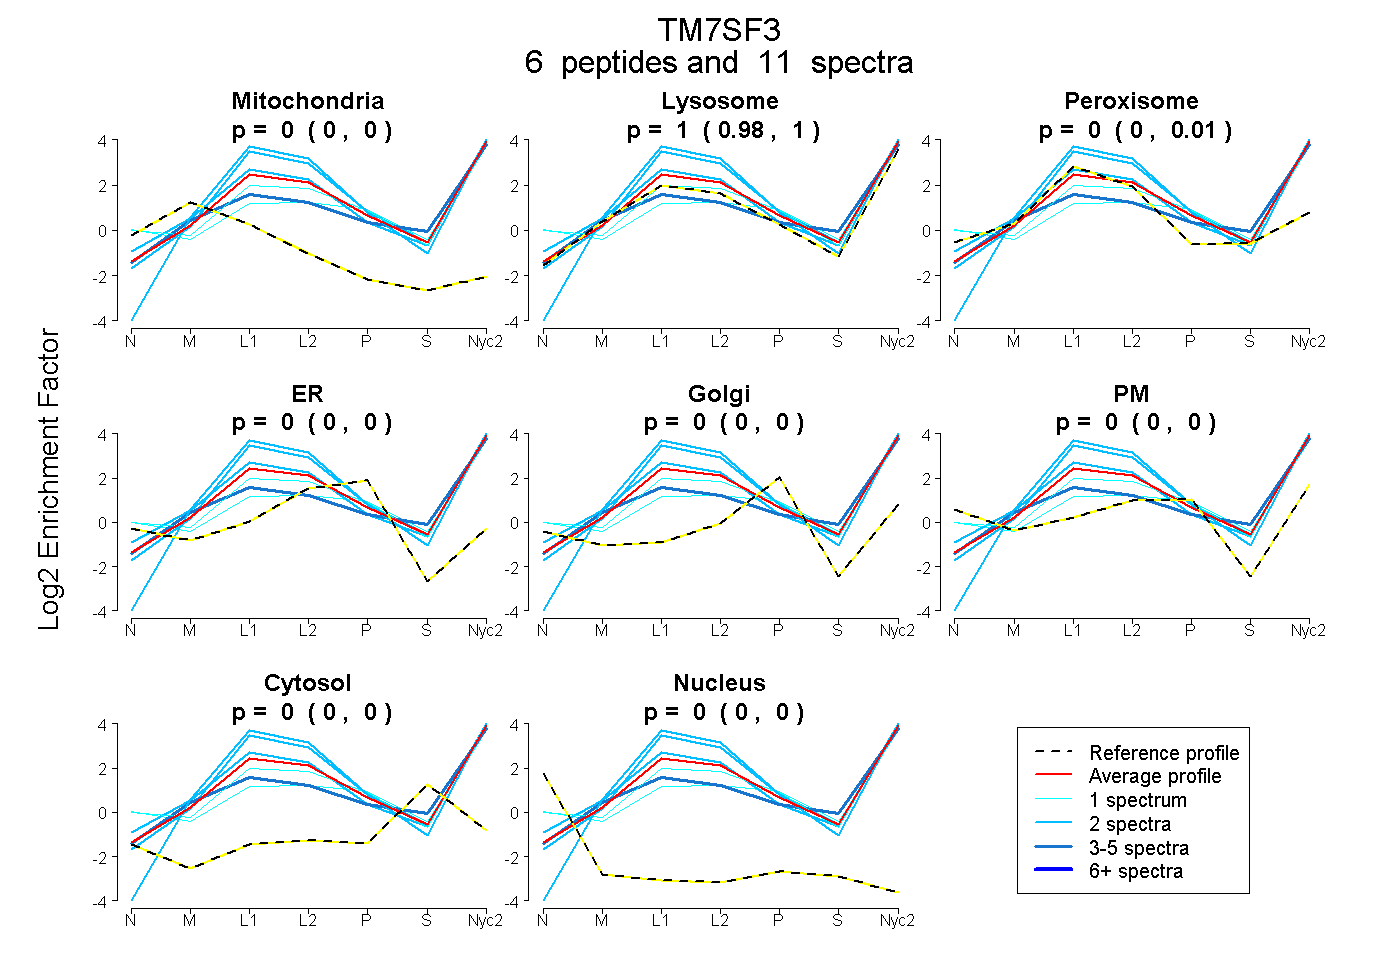
| Expt A |
6 peptides |
11 spectra |
|
0.000 0.000 | 0.000 |
1.000 0.982 | 1.000 |
0.000 0.000 | 0.010 |
0.000 0.000 | 0.000 |
0.000 0.000 | 0.000 |
0.000 0.000 | 0.000 |
0.000 0.000 | 0.000 |
0.000 0.000 | 0.000 |
| 2 spectra, FAPANIGYAR | 0.000 | 0.965 | 0.035 | 0.000 | 0.000 | 0.000 | 0.000 | 0.000 | ||
| 2 spectra, EQPAGER | 0.000 | 0.987 | 0.013 | 0.000 | 0.000 | 0.000 | 0.000 | 0.000 | ||
| 1 spectrum, AAEPPPCDVSTGQESR | 0.000 | 0.662 | 0.000 | 0.000 | 0.000 | 0.297 | 0.040 | 0.000 | ||
| 3 spectra, GRPPFPPHPYK | 0.000 | 0.932 | 0.000 | 0.000 | 0.000 | 0.000 | 0.068 | 0.000 | ||
| 2 spectra, TLLPSTSGTGNDR | 0.000 | 1.000 | 0.000 | 0.000 | 0.000 | 0.000 | 0.000 | 0.000 | ||
| 1 spectrum, LYGWVAR | 0.000 | 0.815 | 0.000 | 0.000 | 0.000 | 0.185 | 0.000 | 0.000 |
| Plot | Mito | Lyso or Perox | ER | Golgi | PM | Cytosol | Nucleus | ||||||
| Expt B |
2 peptides |
3 spectra |
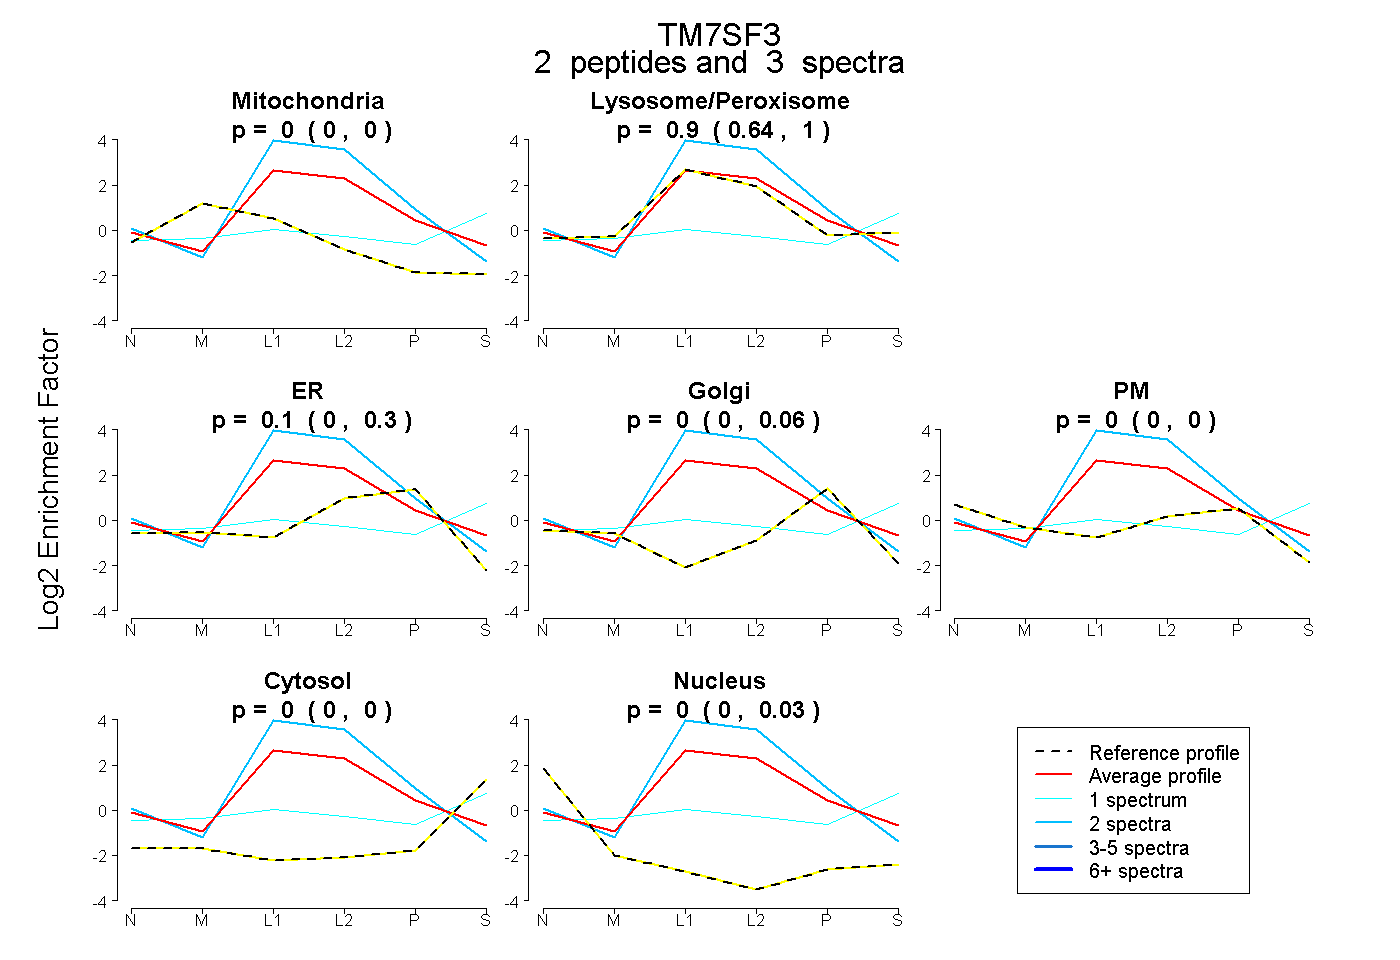 |
0.000 0.000 | 0.000 |
0.895 0.636 | 1.000 |
0.105 0.000 | 0.298 |
0.000 0.000 | 0.058 |
0.000 0.000 | 0.000 |
0.000 0.000 | 0.000 |
0.000 0.000 | 0.030 |
|||
| Plot | Lyso | Other | |||||||||||
| Expt C |
11 peptides |
49 spectra |
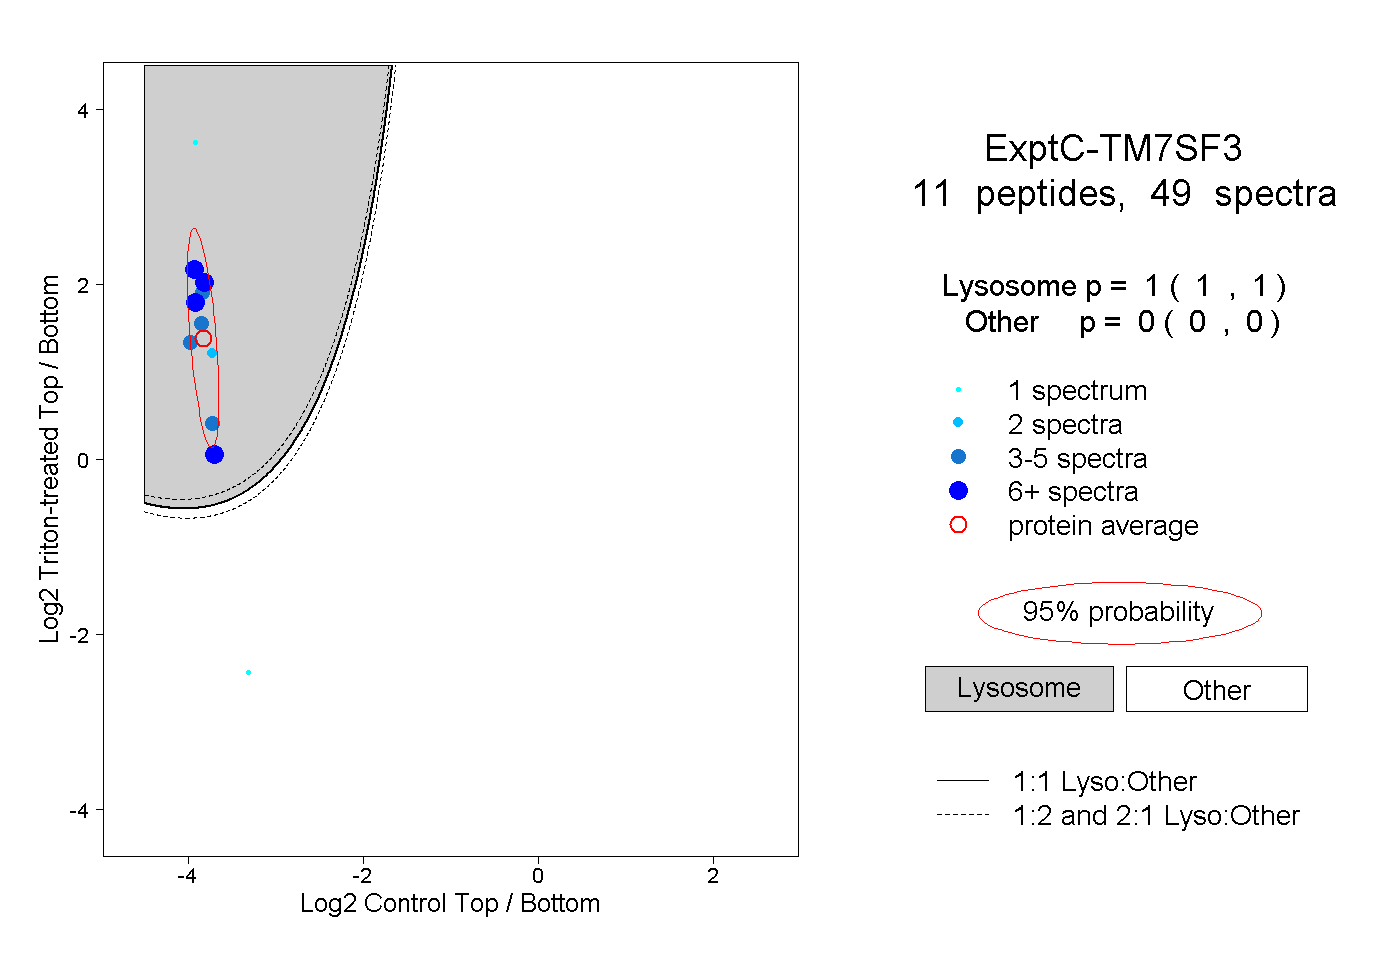 |
1.000 1.000 | 1.000 |
0.000 0.000 | 0.000 |
||||||||
| Plot | Lyso | Other | |||||||||||
| Expt D |
1 peptide |
1 spectrum |
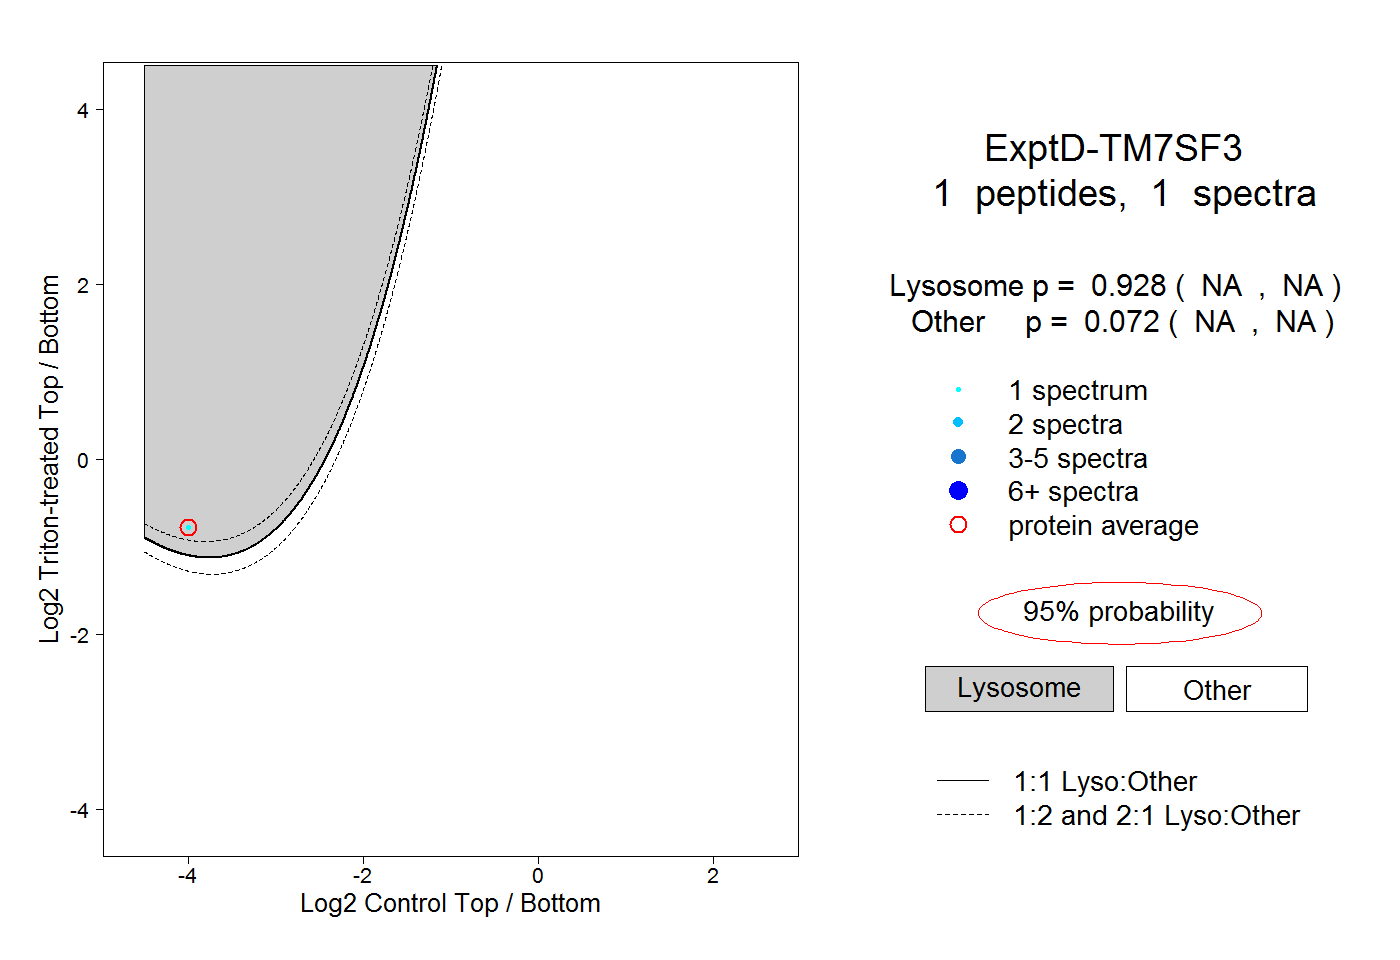 |
0.928 NA | NA |
0.072 NA | NA |