17
17peptides
spectra
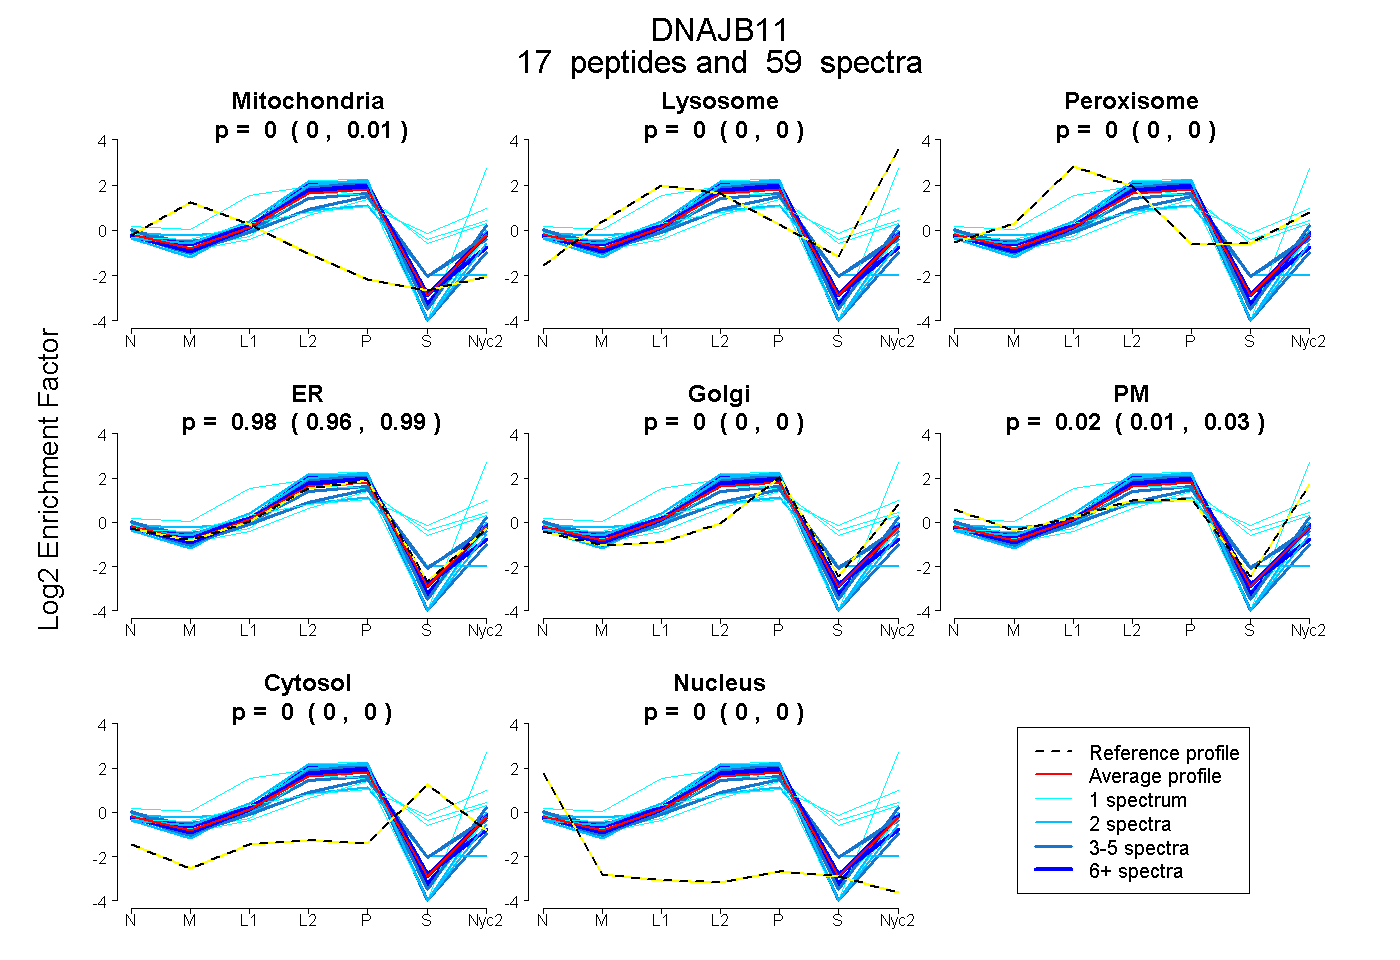
0.000 | 0.007
0.000 | 0.000
0.000 | 0.003
0.964 | 0.986
0.000 | 0.000
0.008 | 0.032
0.000 | 0.000
0.000 | 0.000
7peptides
spectra
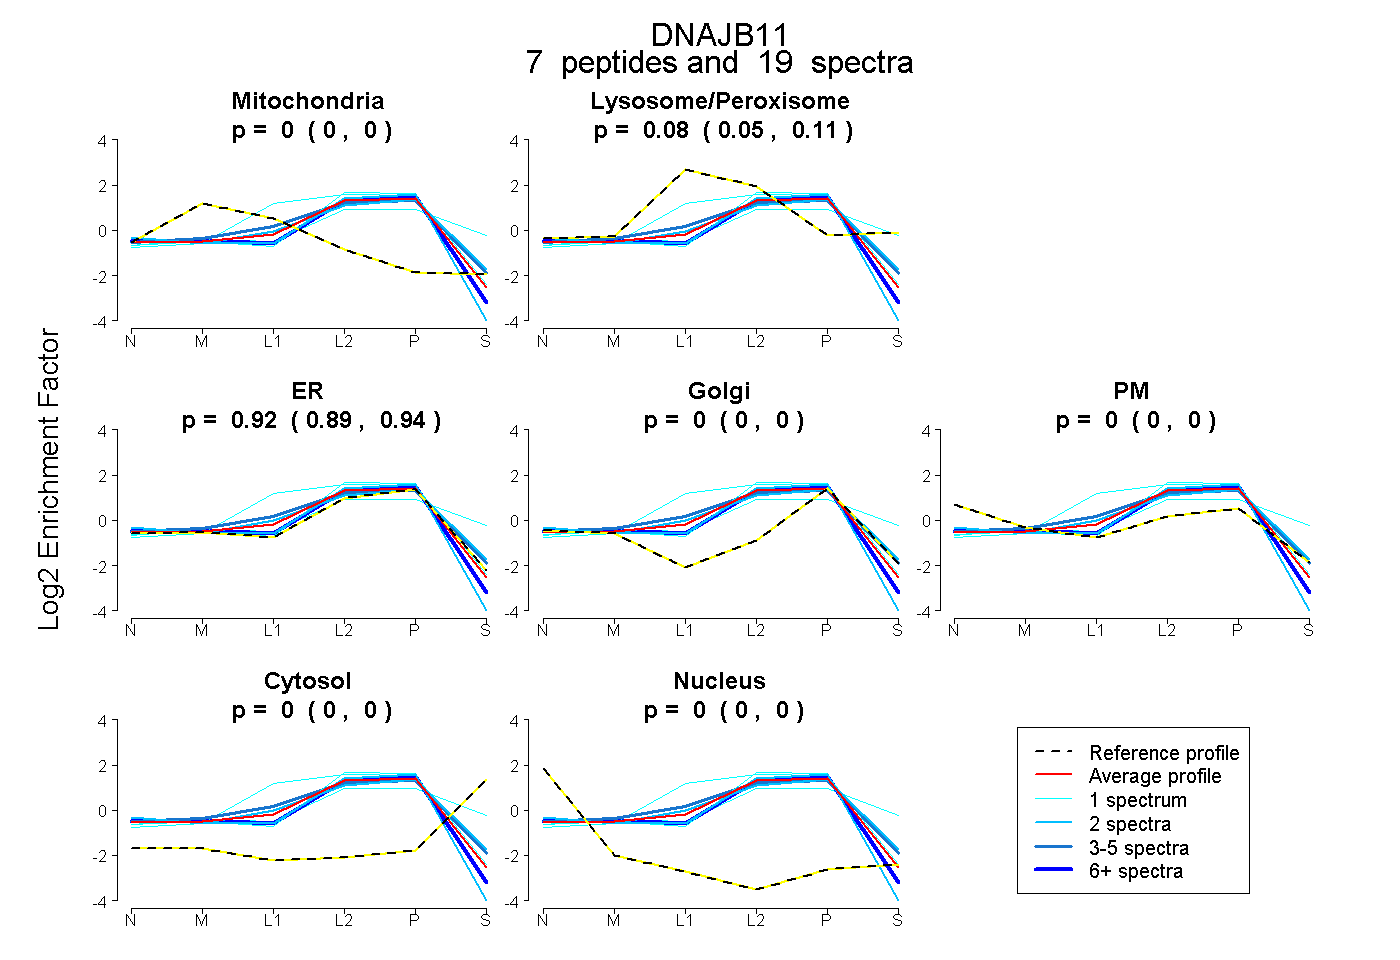
0.000 | 0.000
0.053 | 0.107
0.889 | 0.942
0.000 | 0.000
0.000 | 0.000
0.000 | 0.000
0.000 | 0.000
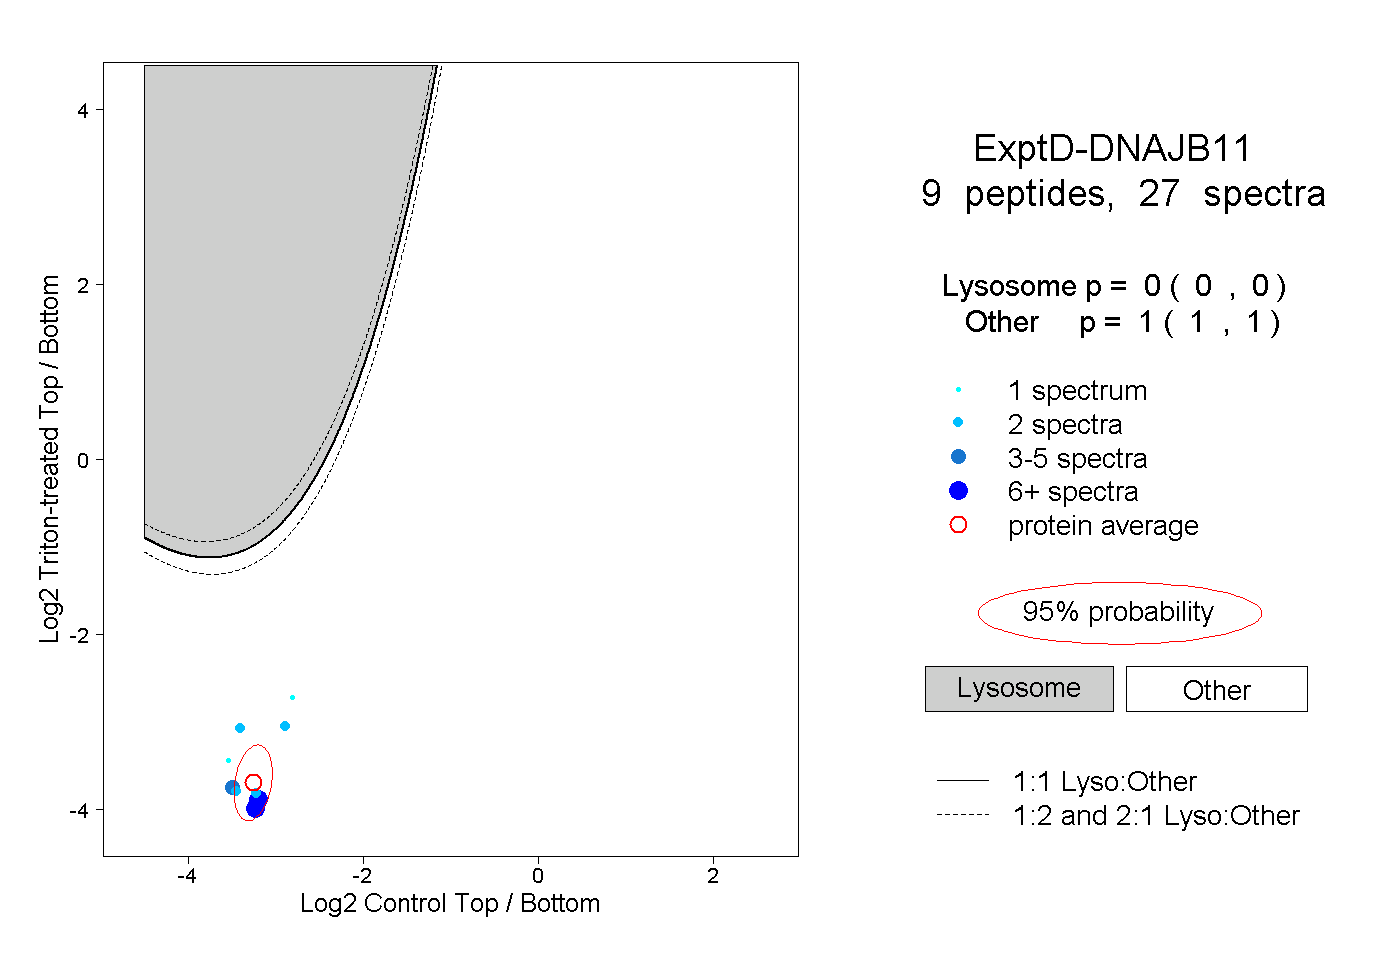
13peptides
spectra
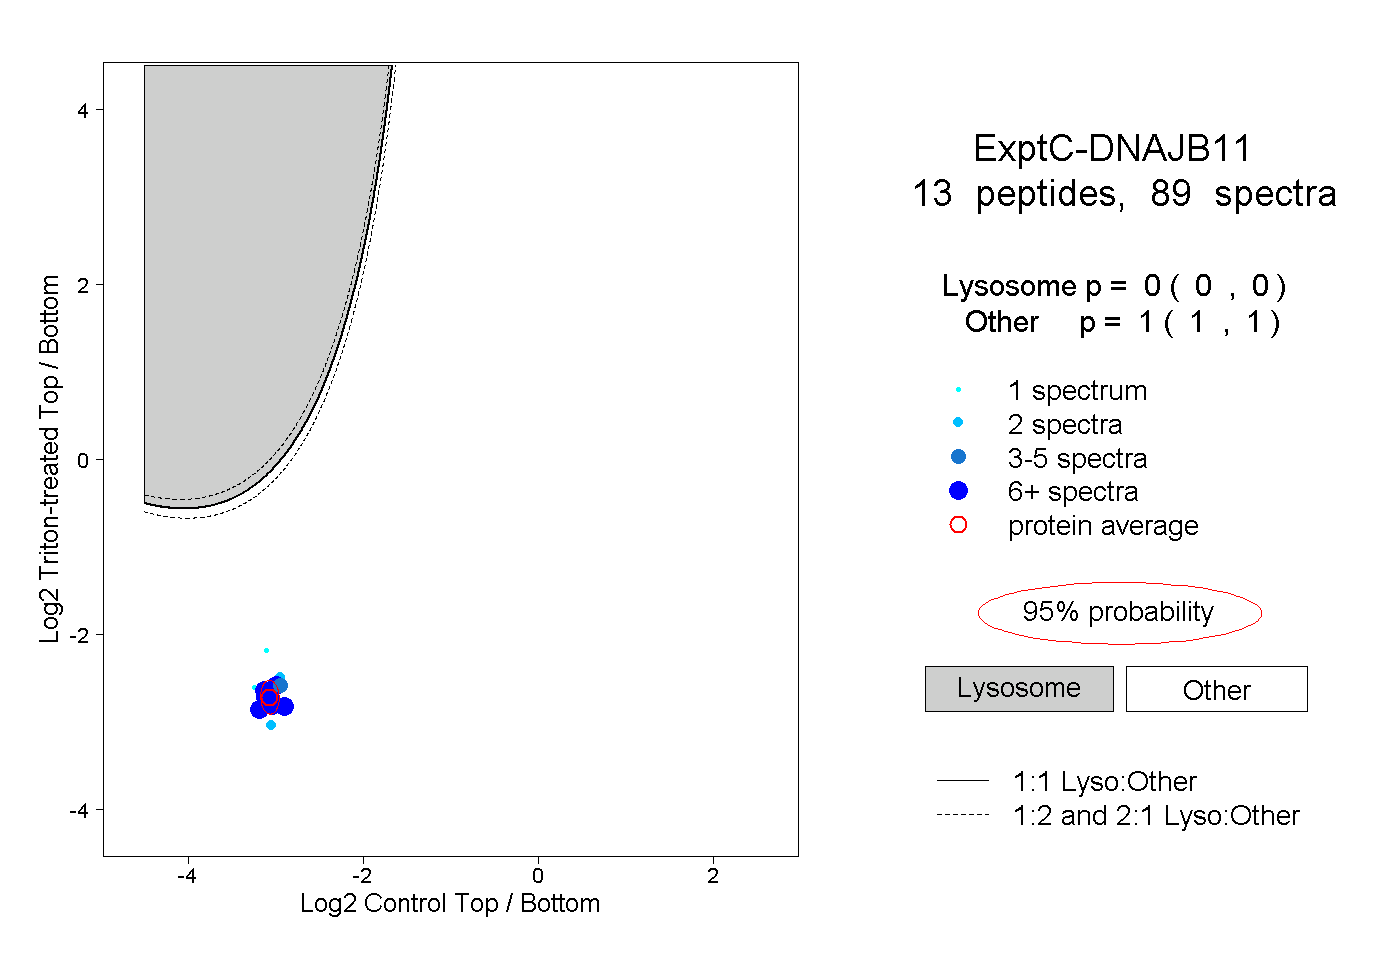
0.000 | 0.000
1.000 | 1.000