UMPS
[ENSRNOP00000002450]
Main page
| | | Plot |
Mito |
Lyso |
|
Perox |
ER |
Golgi |
PM |
Cytosol |
Nucleus |
|
| Expt A |
 16
16
peptides |
47
spectra |
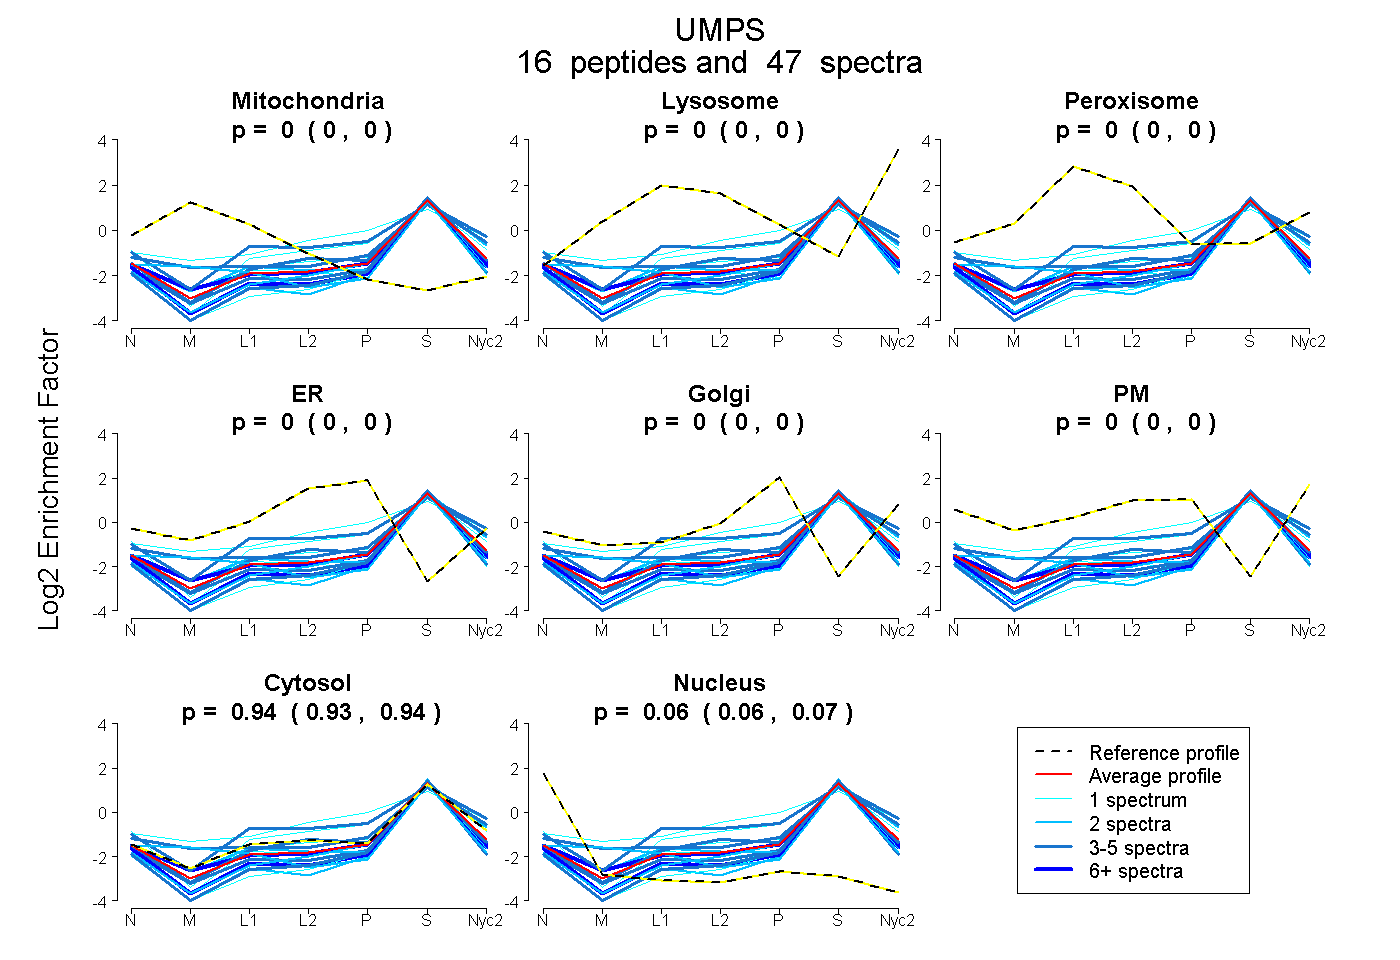 |
0.000
0.000 | 0.000 |
0.000
0.000 | 0.000 |
|
0.000
0.000 | 0.000 |
0.000
0.000 | 0.000 |
0.000
0.000 | 0.000 |
0.000
0.000 | 0.000 |
0.936
0.931 | 0.939 |
0.064
0.059 | 0.068 |
|
| | | Plot |
Mito |
|
Lyso or Perox |
|
ER |
Golgi |
PM |
Cytosol |
Nucleus |
|
| Expt B |
7
peptides |
11
spectra |
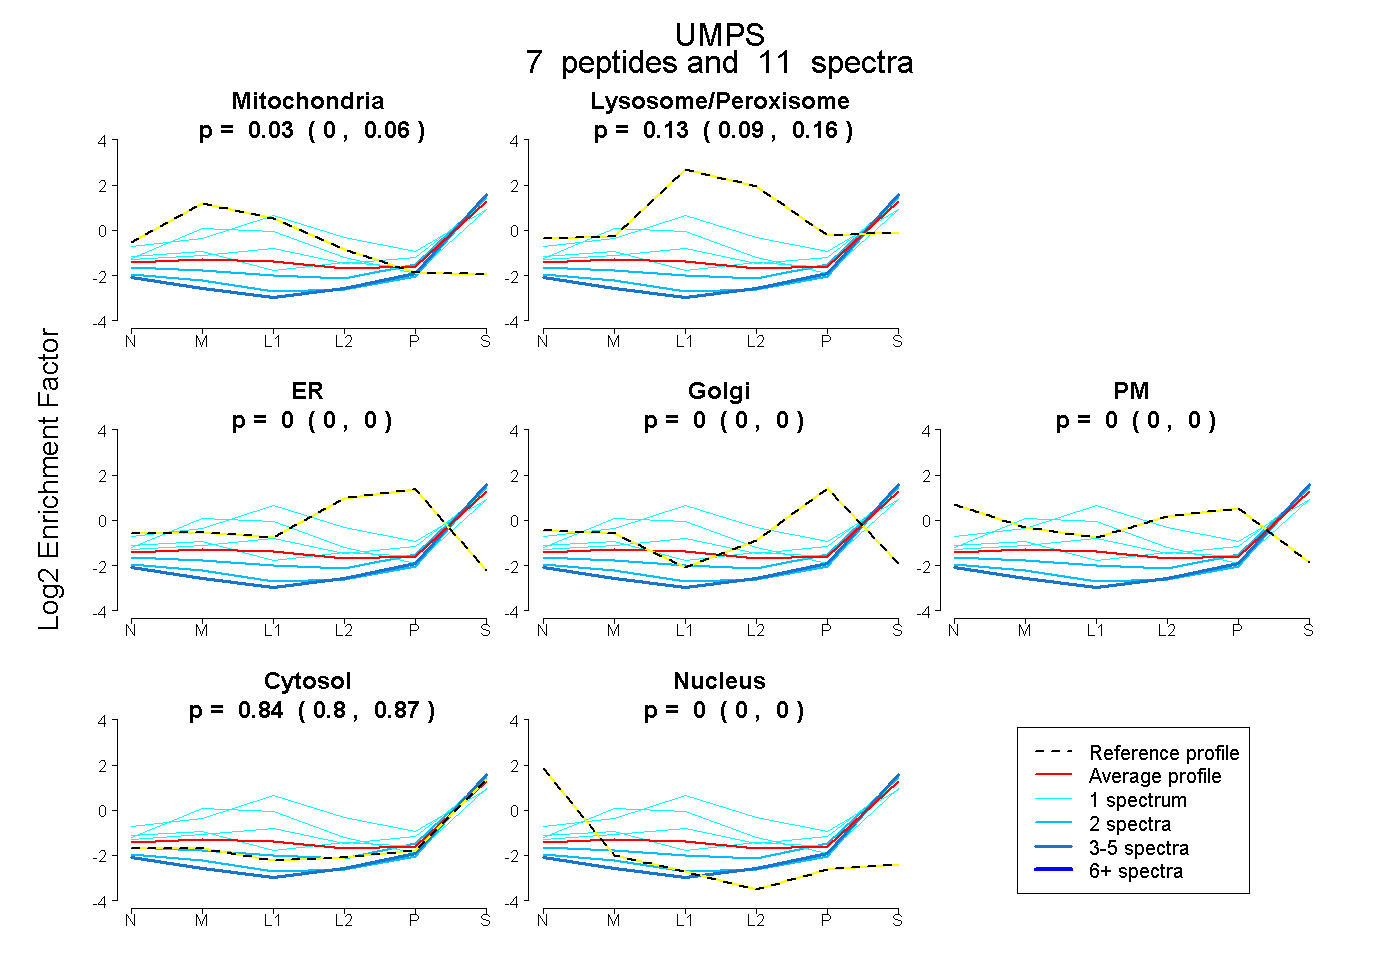 |
0.029
0.000 | 0.064 |
|
0.128
0.086 | 0.164 |
|
0.000
0.000 | 0.000 |
0.000
0.000 | 0.000 |
0.000
0.000 | 0.000 |
0.843
0.804 | 0.872 |
0.000
0.000 | 0.002 |
|
| | | Plot |
|
Lyso |
|
|
|
|
|
|
|
Other |
| Expt C |
9
peptides |
17
spectra |
 |
|
0.000
0.000 | 0.000 |
|
|
|
|
|
|
|
1.000
1.000 | 1.000 |
| 2 spectra, QYESGIFK |
|
0.000 |
|
|
|
|
|
|
|
1.000 |
| 2 spectra, LLTLMQK |
|
0.000 |
|
|
|
|
|
|
|
1.000 |
| 1 spectrum, LQAQGIR |
|
0.000 |
|
|
|
|
|
|
|
1.000 |
| 2 spectra, LEAAEMYR |
|
0.000 |
|
|
|
|
|
|
|
1.000 |
| 4 spectra, GLQEVGLPLHR |
|
0.000 |
|
|
|
|
|
|
|
1.000 |
| 2 spectra, ELSFGAR |
|
0.000 |
|
|
|
|
|
|
|
1.000 |
| 1 spectrum, DYGTK |
|
0.000 |
|
|
|
|
|
|
|
1.000 |
| 1 spectrum, FGSFVLK |
|
0.000 |
|
|
|
|
|
|
|
1.000 |
| 2 spectra, VTDAIVLLDR |
|
0.000 |
|
|
|
|
|
|
|
1.000 |