 16
16peptides
spectra
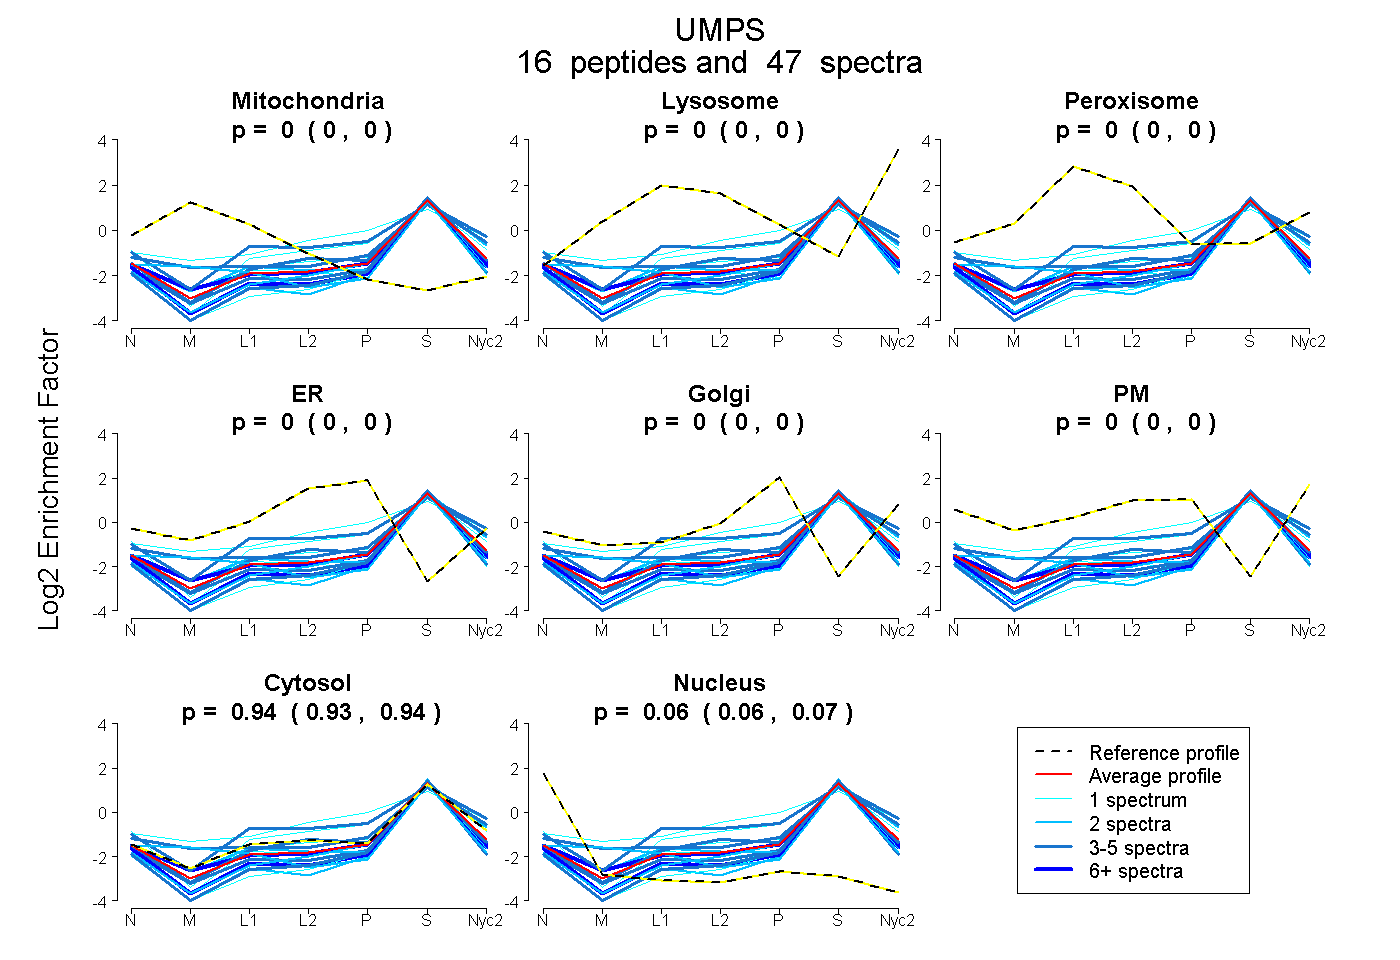
0.000 | 0.000
0.000 | 0.000
0.000 | 0.000
0.000 | 0.000
0.000 | 0.000
0.000 | 0.000
0.931 | 0.939
0.059 | 0.068
7peptides
spectra
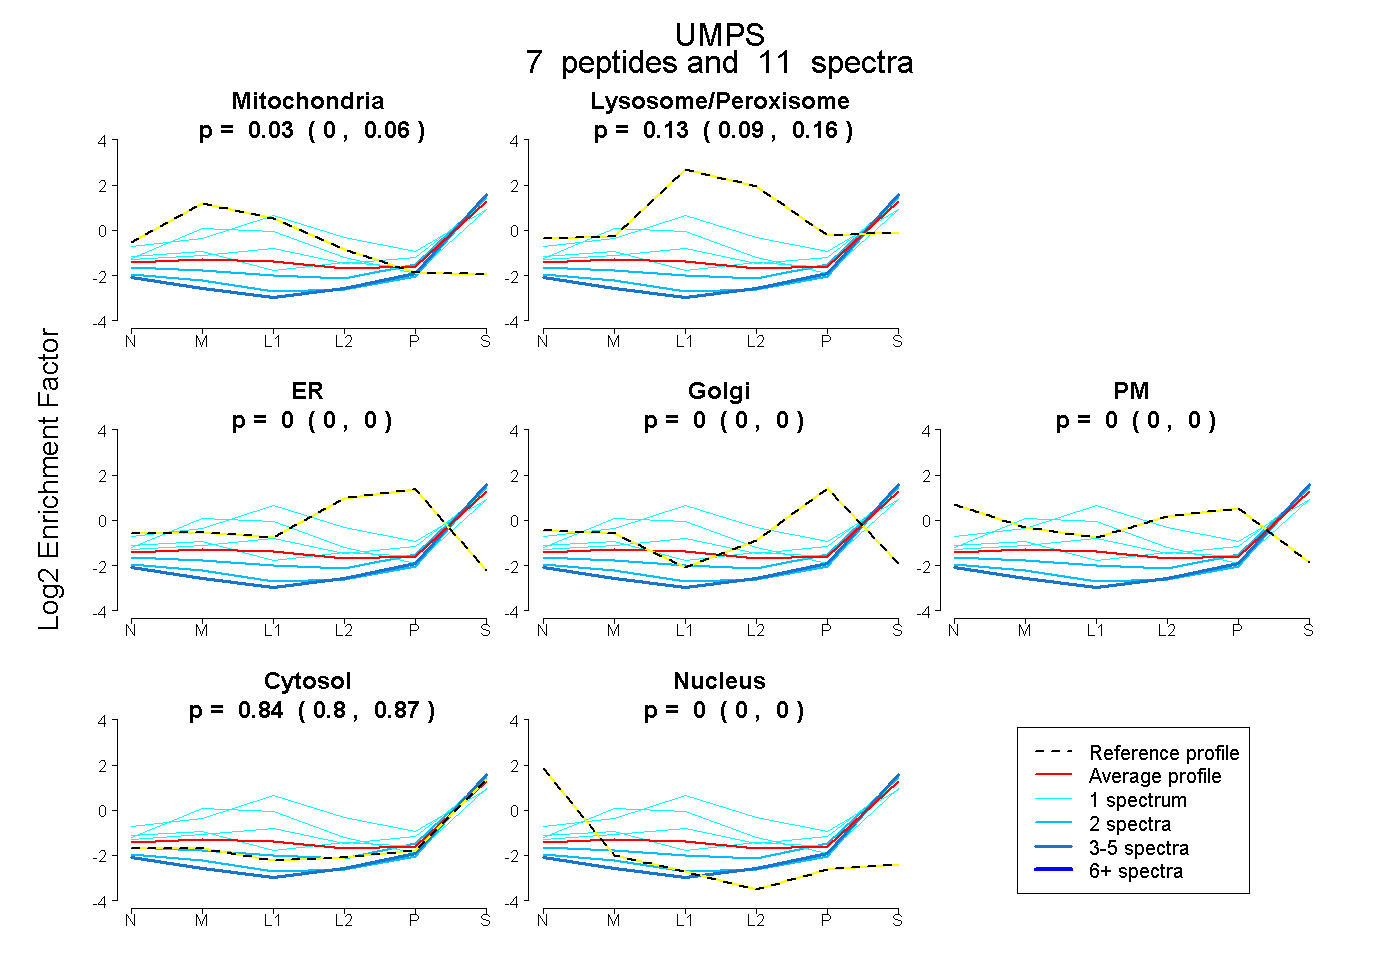
0.000 | 0.064
0.086 | 0.164
0.000 | 0.000
0.000 | 0.000
0.000 | 0.000
0.804 | 0.872
0.000 | 0.002
