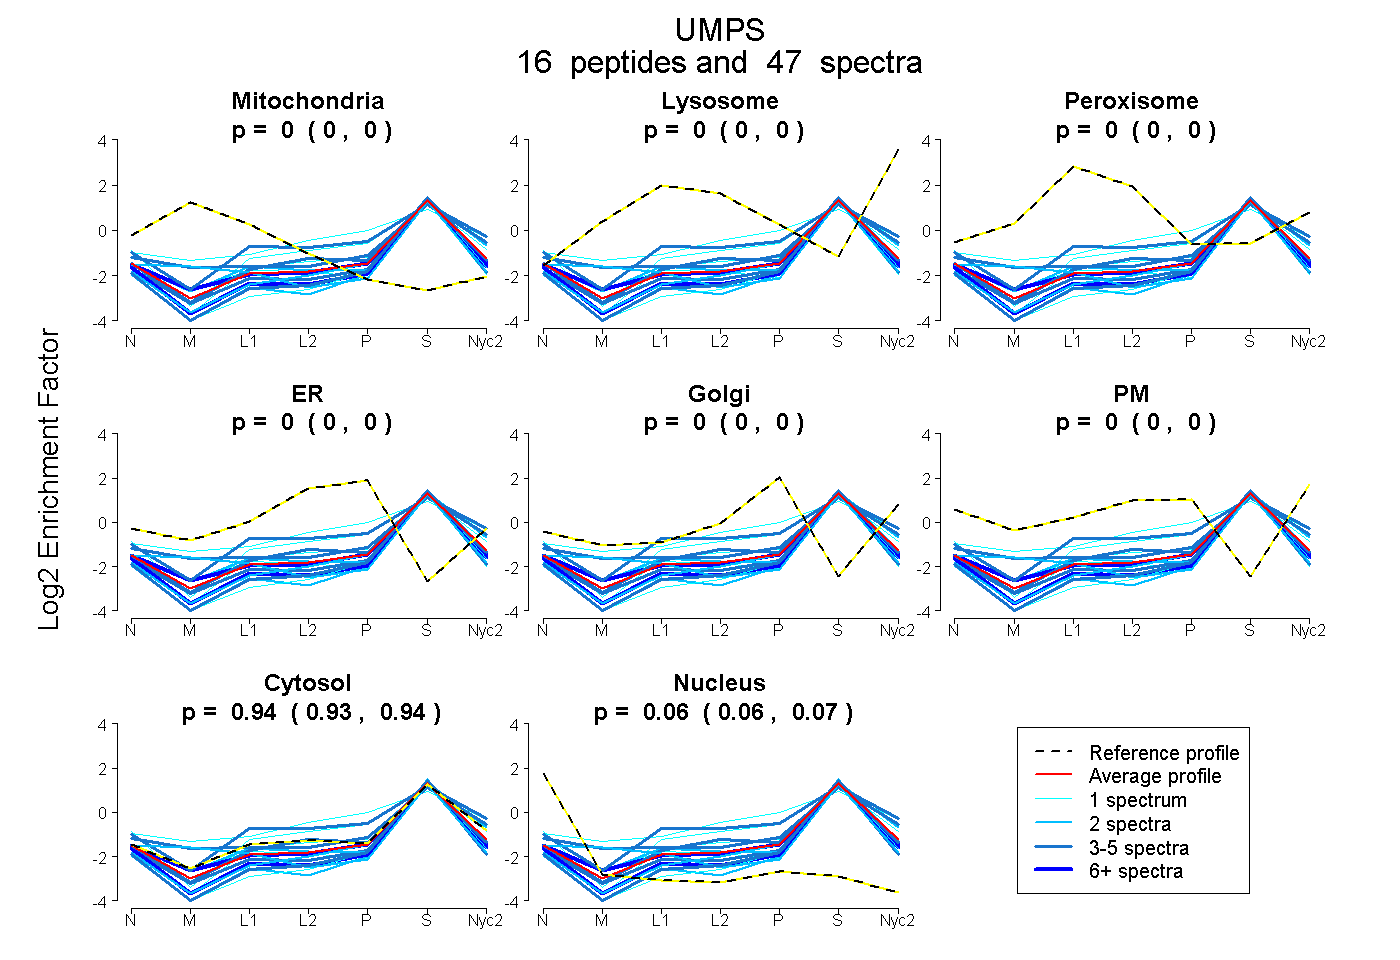
 16
16peptides
spectra
0.000 | 0.000
0.000 | 0.000
0.000 | 0.000
0.000 | 0.000
0.000 | 0.000
0.000 | 0.000
0.931 | 0.939
0.059 | 0.068
| Plot | Mito | Lyso | Perox | ER | Golgi | PM | Cytosol | Nucleus | |||||
| Expt A |
16 peptides |
47 spectra |
|
0.000 0.000 | 0.000 |
0.000 0.000 | 0.000 |
0.000 0.000 | 0.000 |
0.000 0.000 | 0.000 |
0.000 0.000 | 0.000 |
0.000 0.000 | 0.000 |
0.936 0.931 | 0.939 |
0.064 0.059 | 0.068 |
| 3 spectra, LLTLMQK | 0.064 | 0.005 | 0.000 | 0.000 | 0.049 | 0.000 | 0.881 | 0.000 | ||
| 3 spectra, GLQEVGLPLHR | 0.000 | 0.022 | 0.082 | 0.000 | 0.094 | 0.000 | 0.802 | 0.000 | ||
| 6 spectra, GILAAANR | 0.000 | 0.000 | 0.000 | 0.000 | 0.000 | 0.000 | 0.876 | 0.124 | ||
| 4 spectra, ELSFGAR | 0.000 | 0.000 | 0.000 | 0.000 | 0.000 | 0.000 | 0.884 | 0.116 | ||
| 2 spectra, AAWEAYLSR | 0.000 | 0.000 | 0.000 | 0.000 | 0.000 | 0.000 | 0.856 | 0.144 | ||
| 10 spectra, GIVSRPR | 0.000 | 0.000 | 0.000 | 0.000 | 0.000 | 0.000 | 0.921 | 0.079 | ||
| 2 spectra, FGSFVLK | 0.000 | 0.000 | 0.000 | 0.000 | 0.000 | 0.000 | 0.983 | 0.017 | ||
| 1 spectrum, ELLQLADALGPSICMLK | 0.000 | 0.006 | 0.112 | 0.000 | 0.225 | 0.000 | 0.657 | 0.000 | ||
| 1 spectrum, GSDVIIVGR | 0.000 | 0.000 | 0.000 | 0.000 | 0.000 | 0.000 | 0.864 | 0.136 | ||
| 2 spectra, SGLSSPVYIDLR | 0.049 | 0.000 | 0.000 | 0.000 | 0.000 | 0.000 | 0.832 | 0.119 | ||
| 1 spectrum, AAVGMAEEHCEFVIGFISGSR | 0.000 | 0.000 | 0.000 | 0.000 | 0.000 | 0.000 | 0.838 | 0.162 | ||
| 4 spectra, LEAAEMYR | 0.000 | 0.000 | 0.000 | 0.000 | 0.000 | 0.000 | 0.963 | 0.037 | ||
| 1 spectrum, AELPGVHPLASK | 0.000 | 0.000 | 0.000 | 0.000 | 0.000 | 0.000 | 1.000 | 0.000 | ||
| 1 spectrum, ACLLIAEMSSAGSLATGDYTK | 0.000 | 0.000 | 0.000 | 0.087 | 0.000 | 0.000 | 0.913 | 0.000 | ||
| 2 spectra, HEFLIFEDR | 0.000 | 0.000 | 0.000 | 0.000 | 0.000 | 0.000 | 0.938 | 0.062 | ||
| 4 spectra, VTDAIVLLDR | 0.000 | 0.000 | 0.000 | 0.000 | 0.000 | 0.000 | 0.905 | 0.095 |
| Plot | Mito | Lyso or Perox | ER | Golgi | PM | Cytosol | Nucleus | ||||||
| Expt B |
7 peptides |
11 spectra |
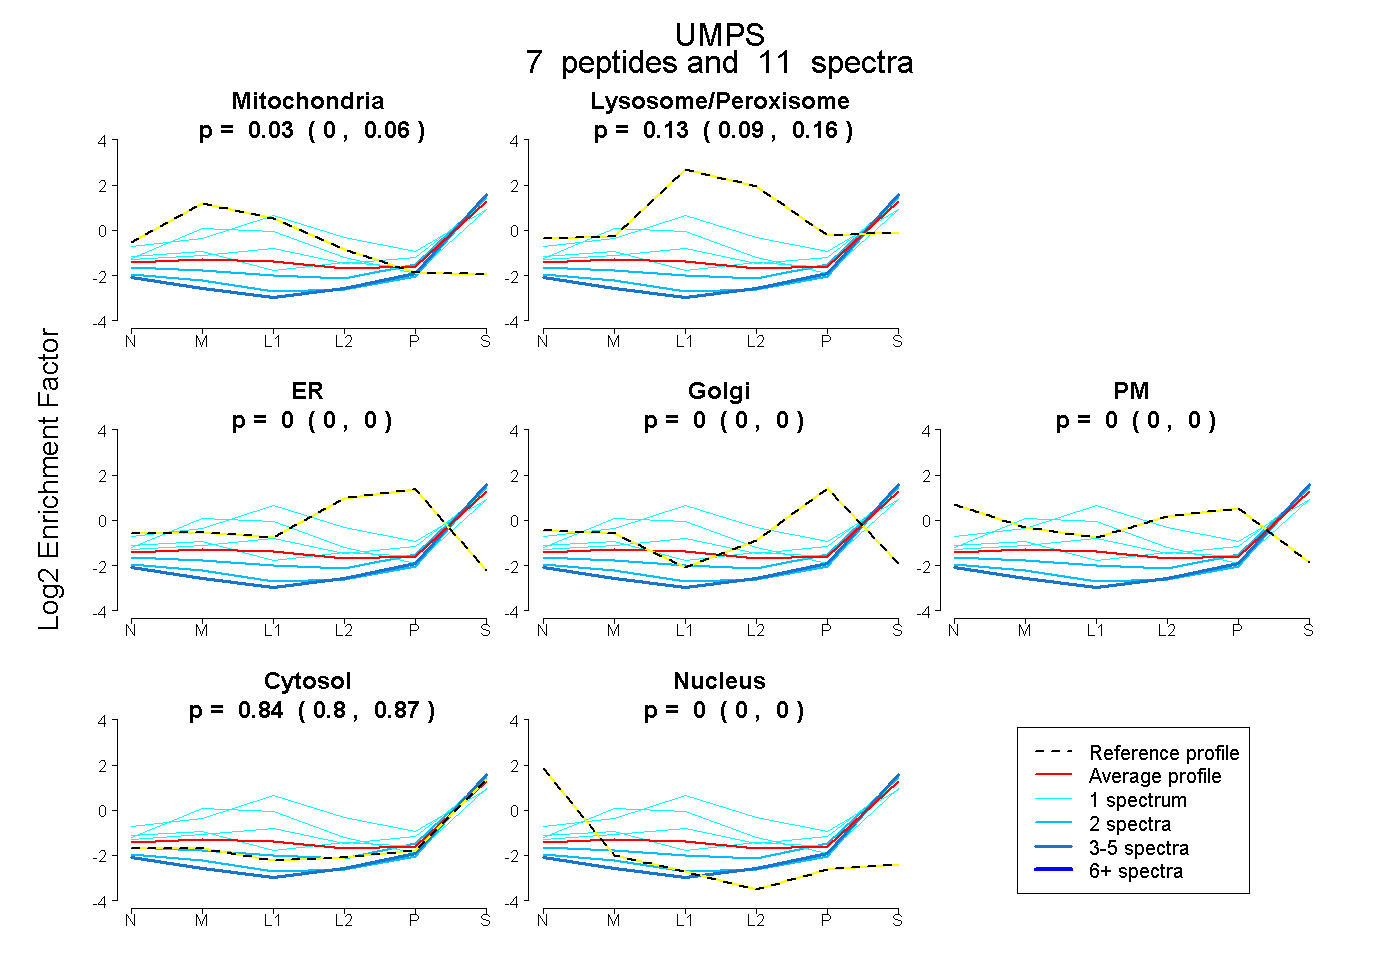 |
0.029 0.000 | 0.064 |
0.128 0.086 | 0.164 |
0.000 0.000 | 0.000 |
0.000 0.000 | 0.000 |
0.000 0.000 | 0.000 |
0.843 0.804 | 0.872 |
0.000 0.000 | 0.002 |
|||
| Plot | Lyso | Other | |||||||||||
| Expt C |
9 peptides |
17 spectra |
 |
0.000 0.000 | 0.000 |
1.000 1.000 | 1.000 |