 9
9peptides
spectra
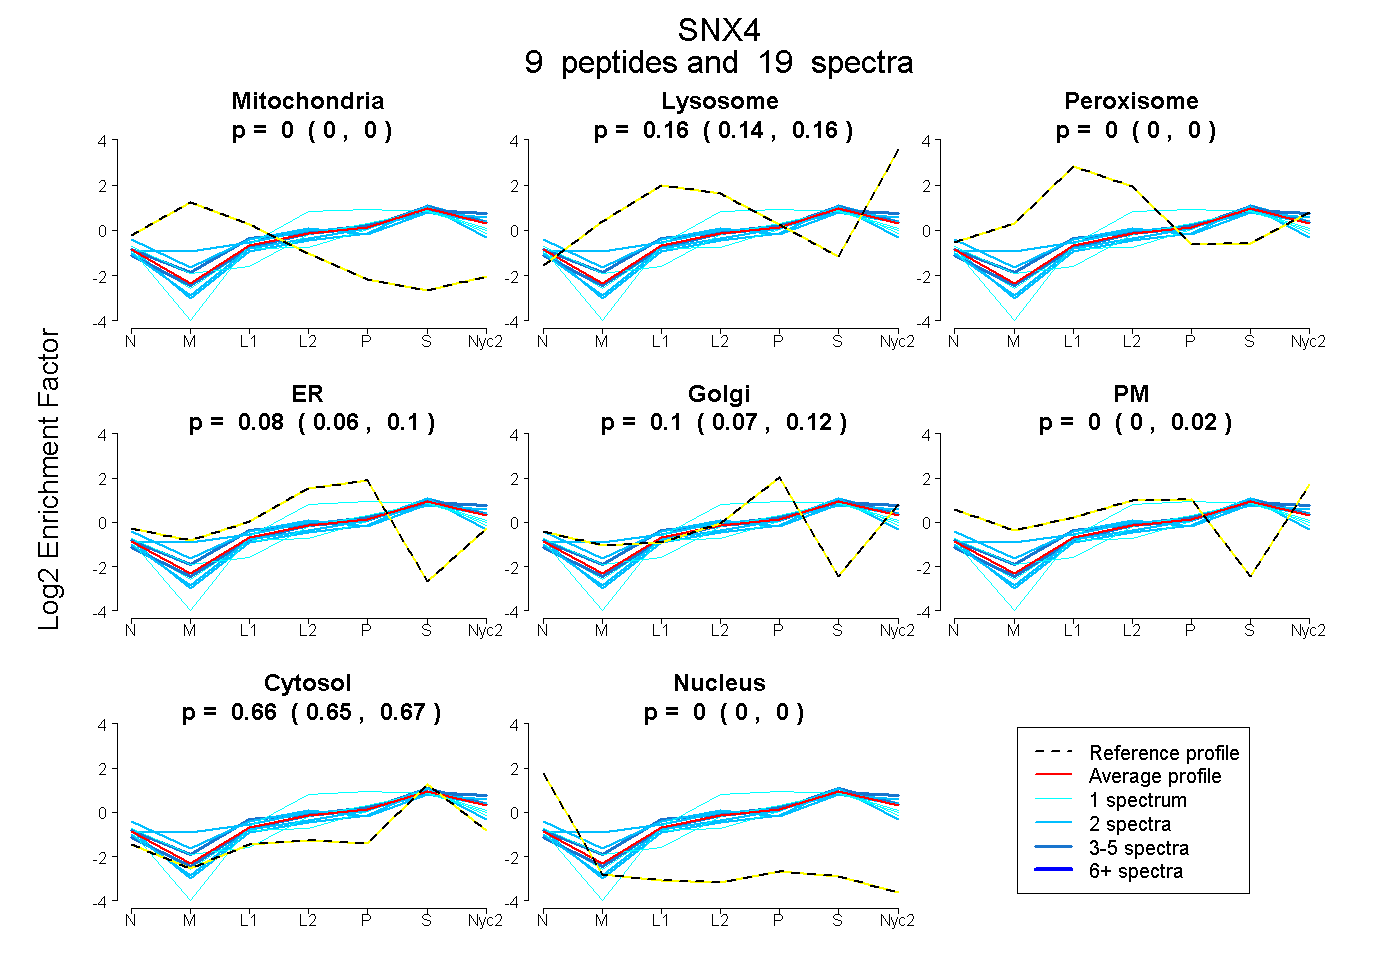
0.000 | 0.000
0.142 | 0.164
0.000 | 0.000
0.056 | 0.101
0.071 | 0.117
0.000 | 0.022
0.655 | 0.672
0.000 | 0.000
2peptides
spectra
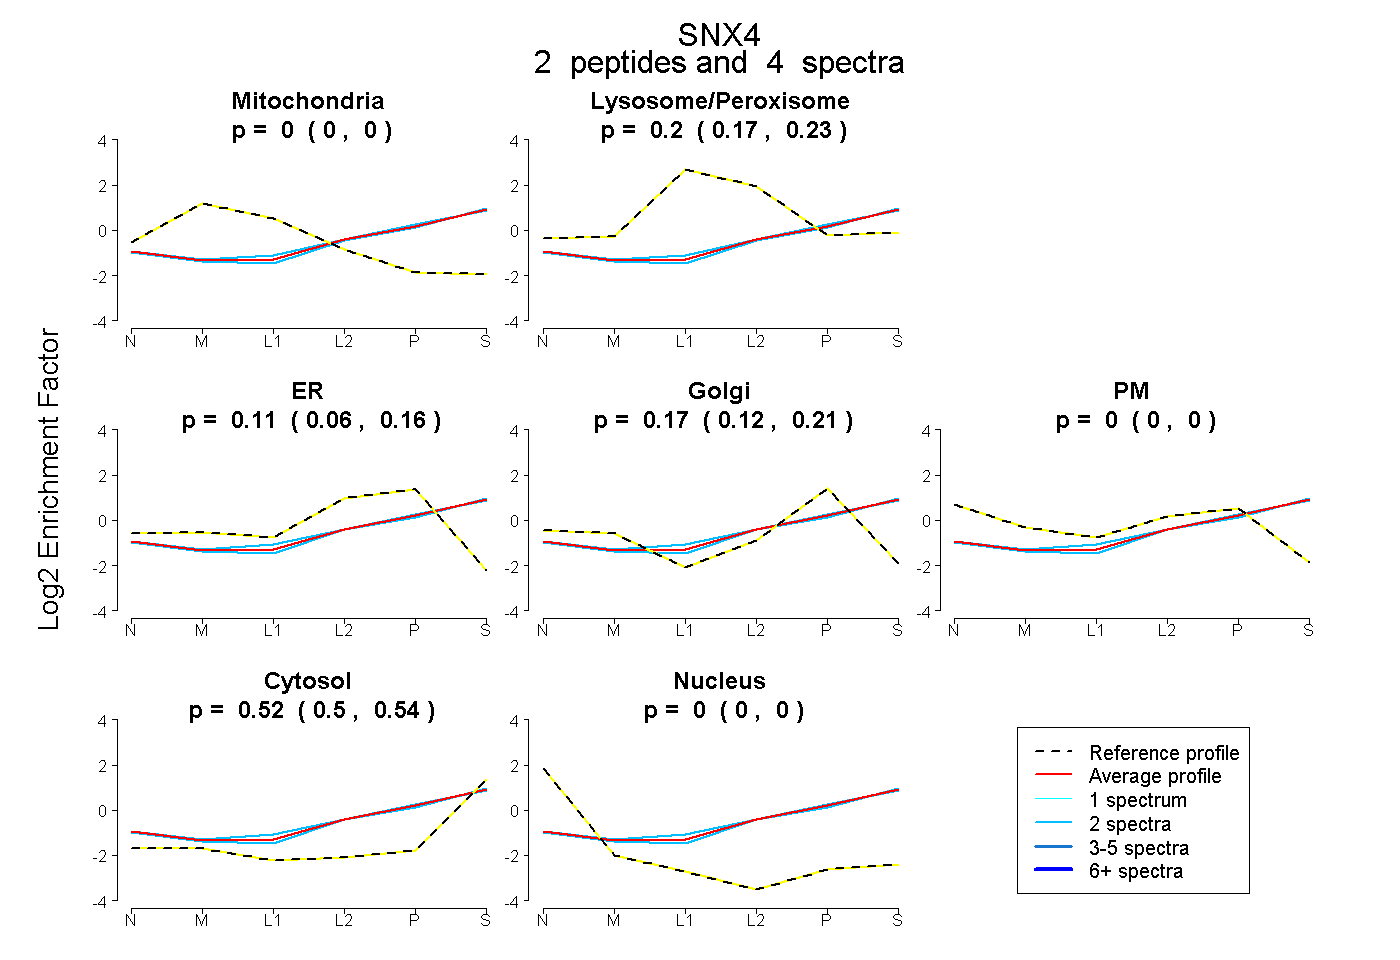
0.000 | 0.000
0.167 | 0.226
0.056 | 0.161
0.124 | 0.208
0.000 | 0.000
0.498 | 0.535
0.000 | 0.000
10peptides
spectra
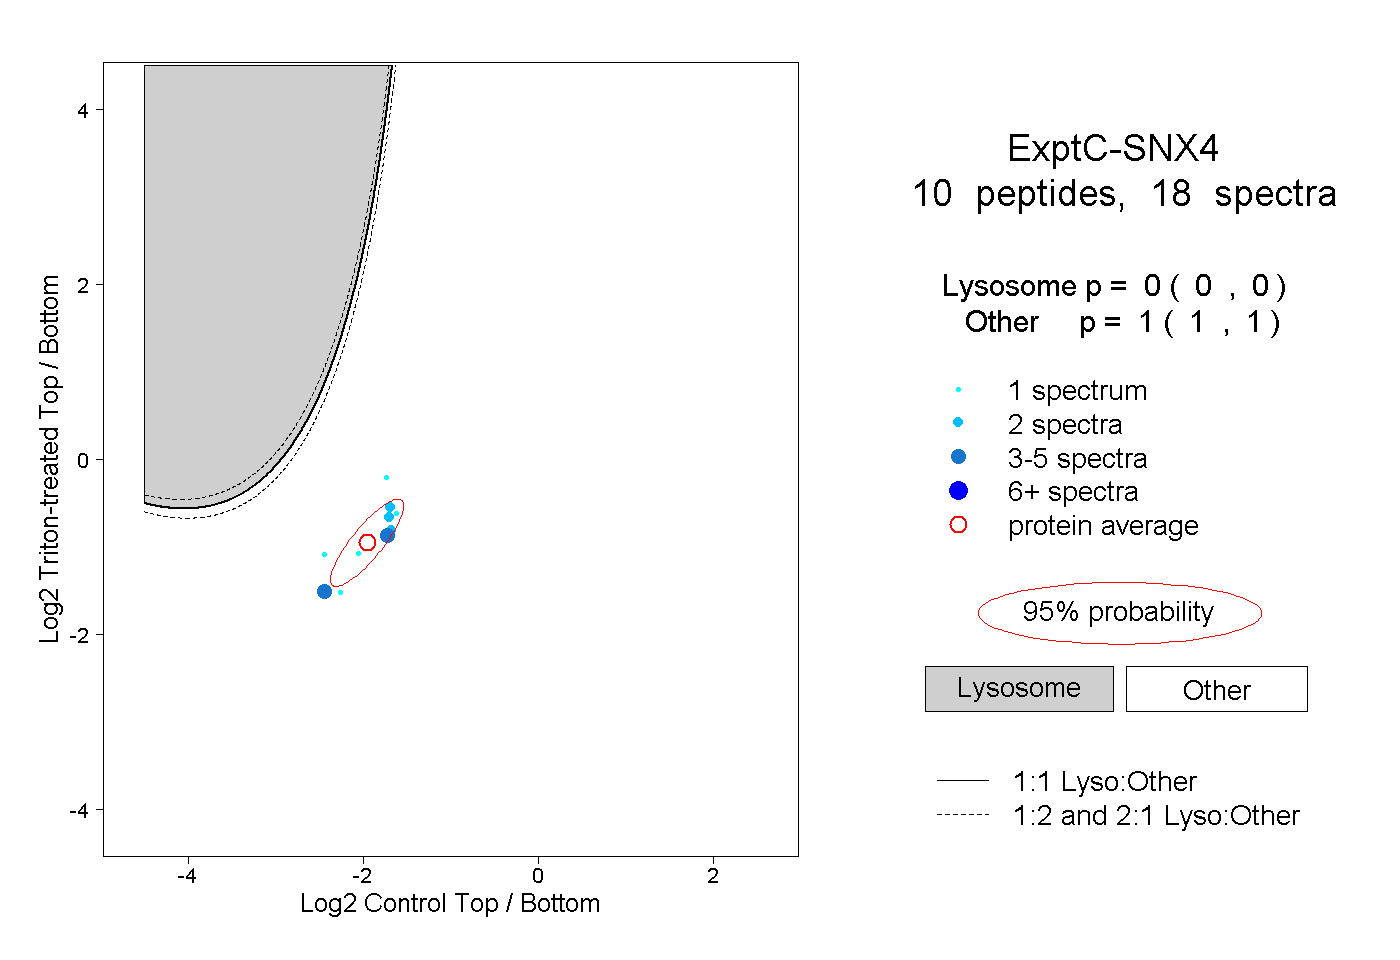
0.000 | 0.000
1.000 | 1.000
1peptide
spectra
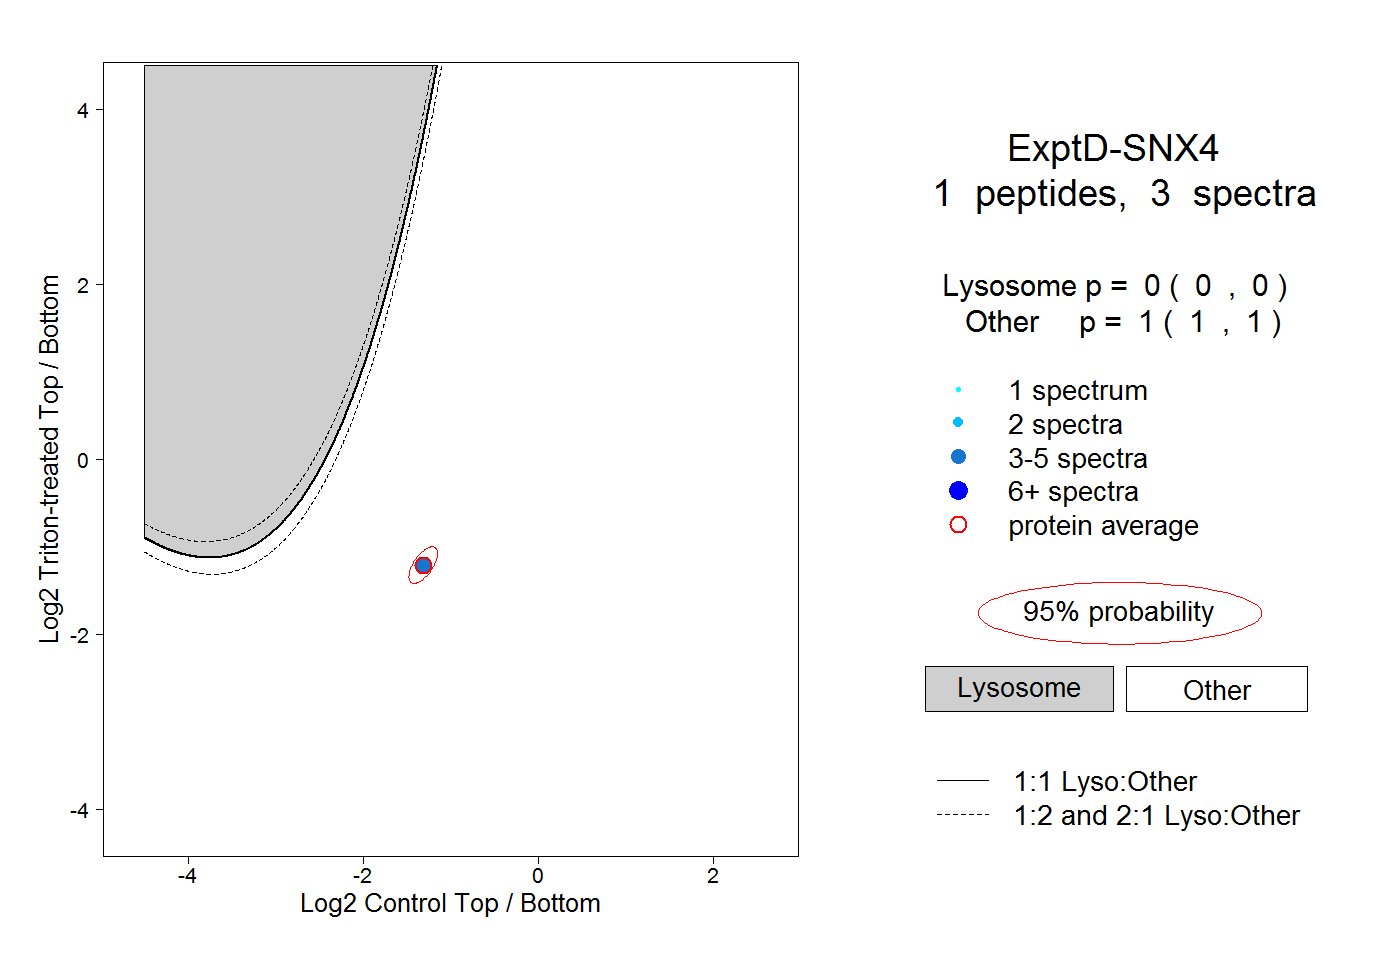
0.000 | 0.000
1.000 | 1.000