 7
7peptides
spectra
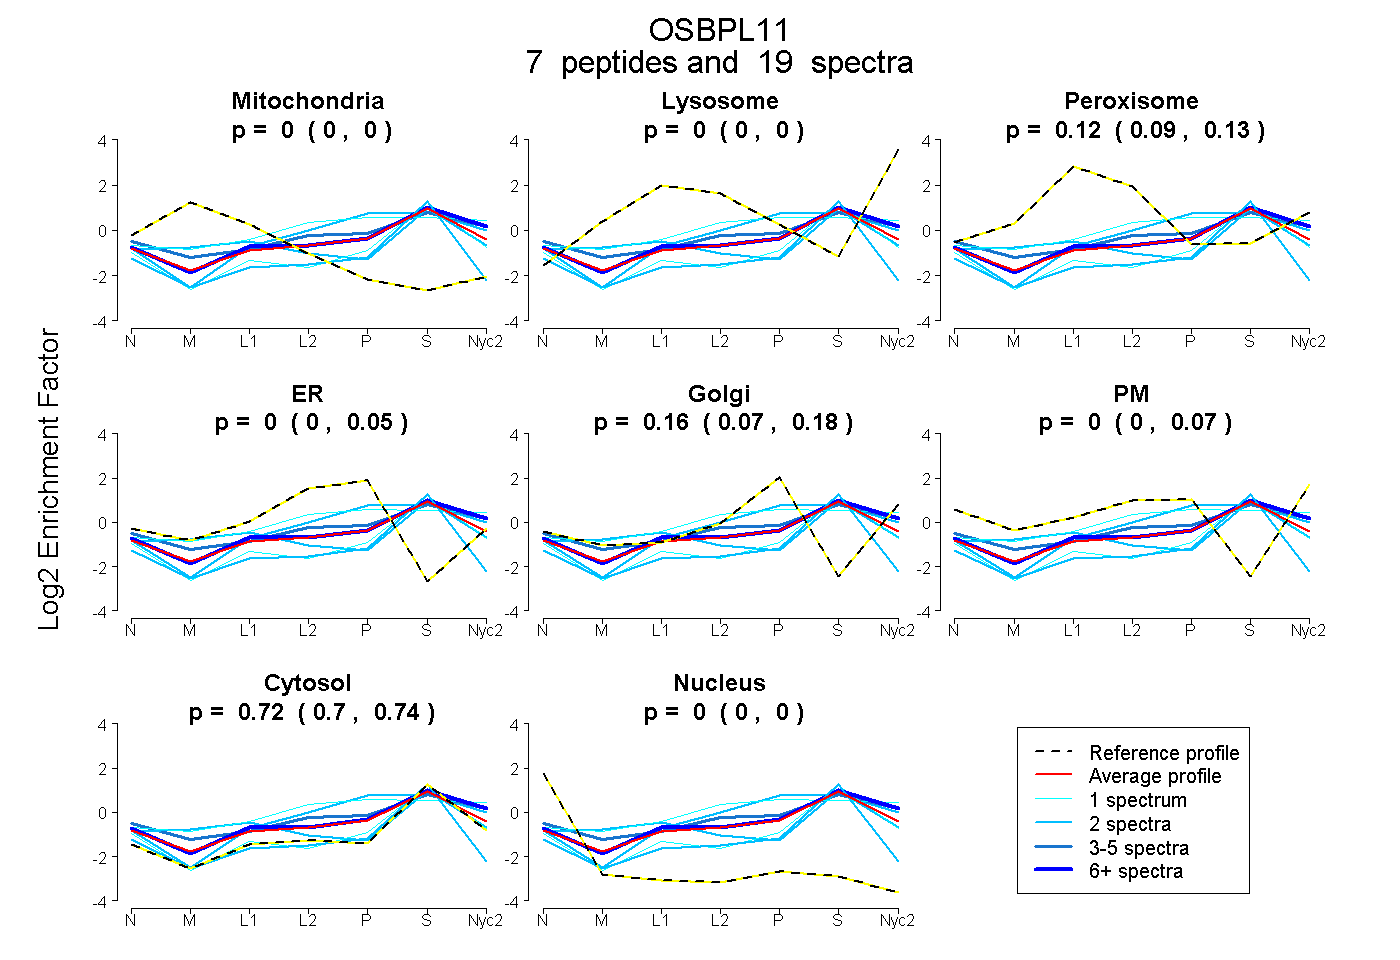
0.000 | 0.000
0.000 | 0.000
0.089 | 0.133
0.000 | 0.048
0.071 | 0.177
0.000 | 0.072
0.699 | 0.738
0.000 | 0.000
| Plot | Mito | Lyso | Perox | ER | Golgi | PM | Cytosol | Nucleus | |||||
| Expt A |
7 peptides |
19 spectra |
|
0.000 0.000 | 0.000 |
0.000 0.000 | 0.000 |
0.123 0.089 | 0.133 |
0.000 0.000 | 0.048 |
0.160 0.071 | 0.177 |
0.000 0.000 | 0.072 |
0.716 0.699 | 0.738 |
0.000 0.000 | 0.000 |
| 2 spectra, YNLTNTVVCR | 0.000 | 0.000 | 0.000 | 0.000 | 0.000 | 0.000 | 0.886 | 0.114 | ||
| 2 spectra, AHLHPDHLVEVR | 0.000 | 0.059 | 0.000 | 0.200 | 0.128 | 0.000 | 0.613 | 0.000 | ||
| 1 spectrum, SILTVPWVELGGK | 0.000 | 0.000 | 0.000 | 0.000 | 0.056 | 0.000 | 0.923 | 0.021 | ||
| 4 spectra, EMMSHAEGQQR | 0.000 | 0.033 | 0.063 | 0.000 | 0.000 | 0.277 | 0.626 | 0.000 | ||
| 1 spectrum, QDPFESR | 0.000 | 0.147 | 0.139 | 0.080 | 0.199 | 0.000 | 0.434 | 0.000 | ||
| 2 spectra, LGMDLTR | 0.163 | 0.000 | 0.167 | 0.000 | 0.000 | 0.000 | 0.670 | 0.000 | ||
| 7 spectra, VTAEVK | 0.000 | 0.108 | 0.004 | 0.000 | 0.000 | 0.158 | 0.730 | 0.000 |
| Plot | Lyso | Other | |||||||||||
| Expt C |
7 peptides |
13 spectra |
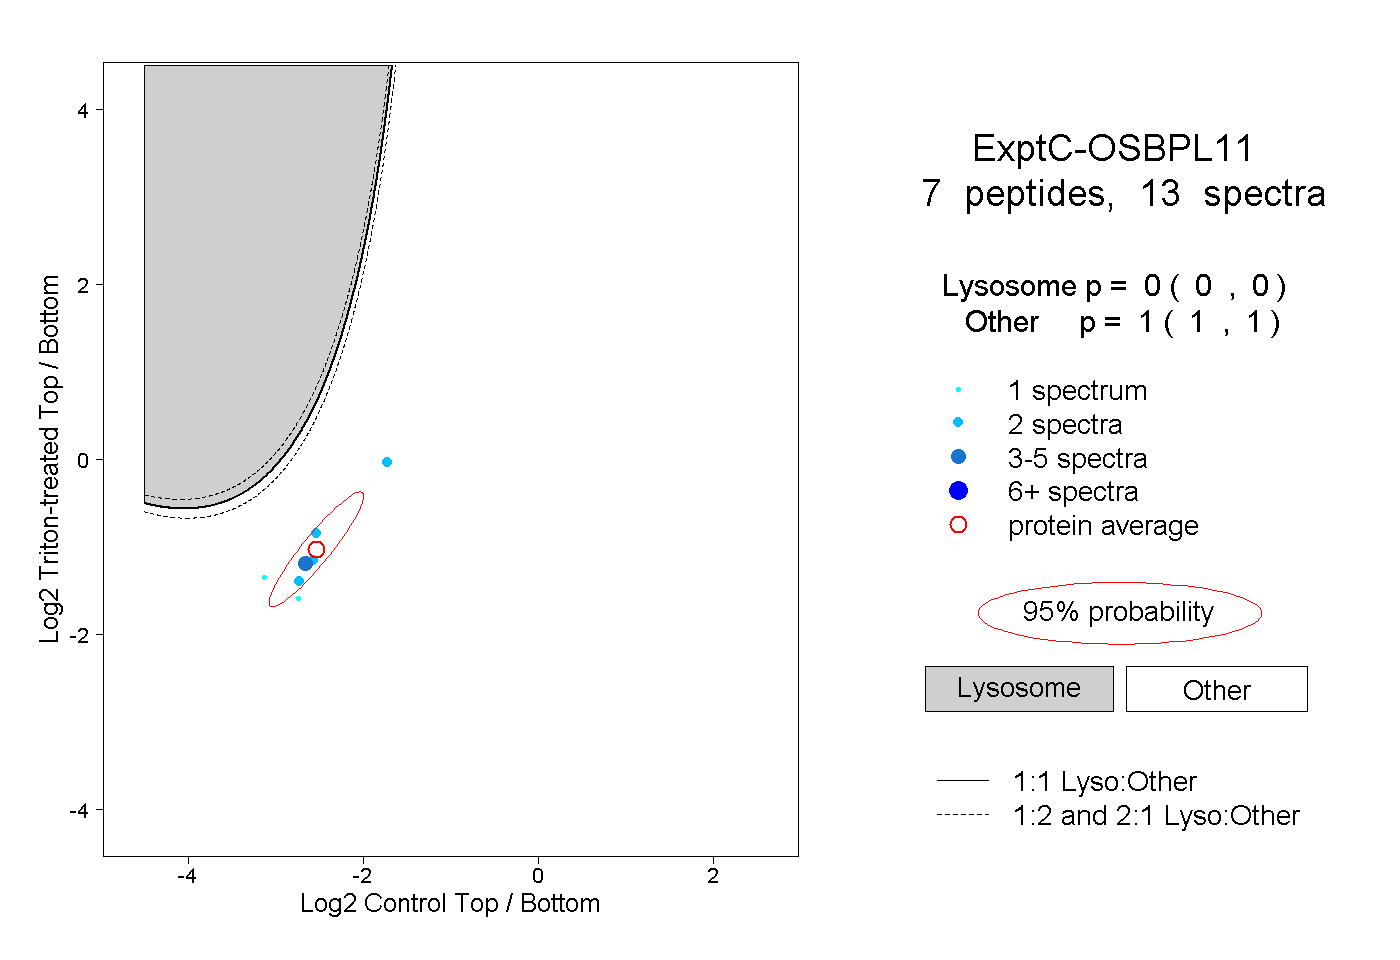 |
0.000 0.000 | 0.000 |
1.000 1.000 | 1.000 |