 2
2peptides
spectra
0.000 | 0.000
0.000 | 0.000
0.000 | 0.000
0.309 | 0.449
0.000 | 0.067
0.015 | 0.134
0.469 | 0.494
0.005 | 0.032
1peptide
spectrum
NA | NA
NA | NA
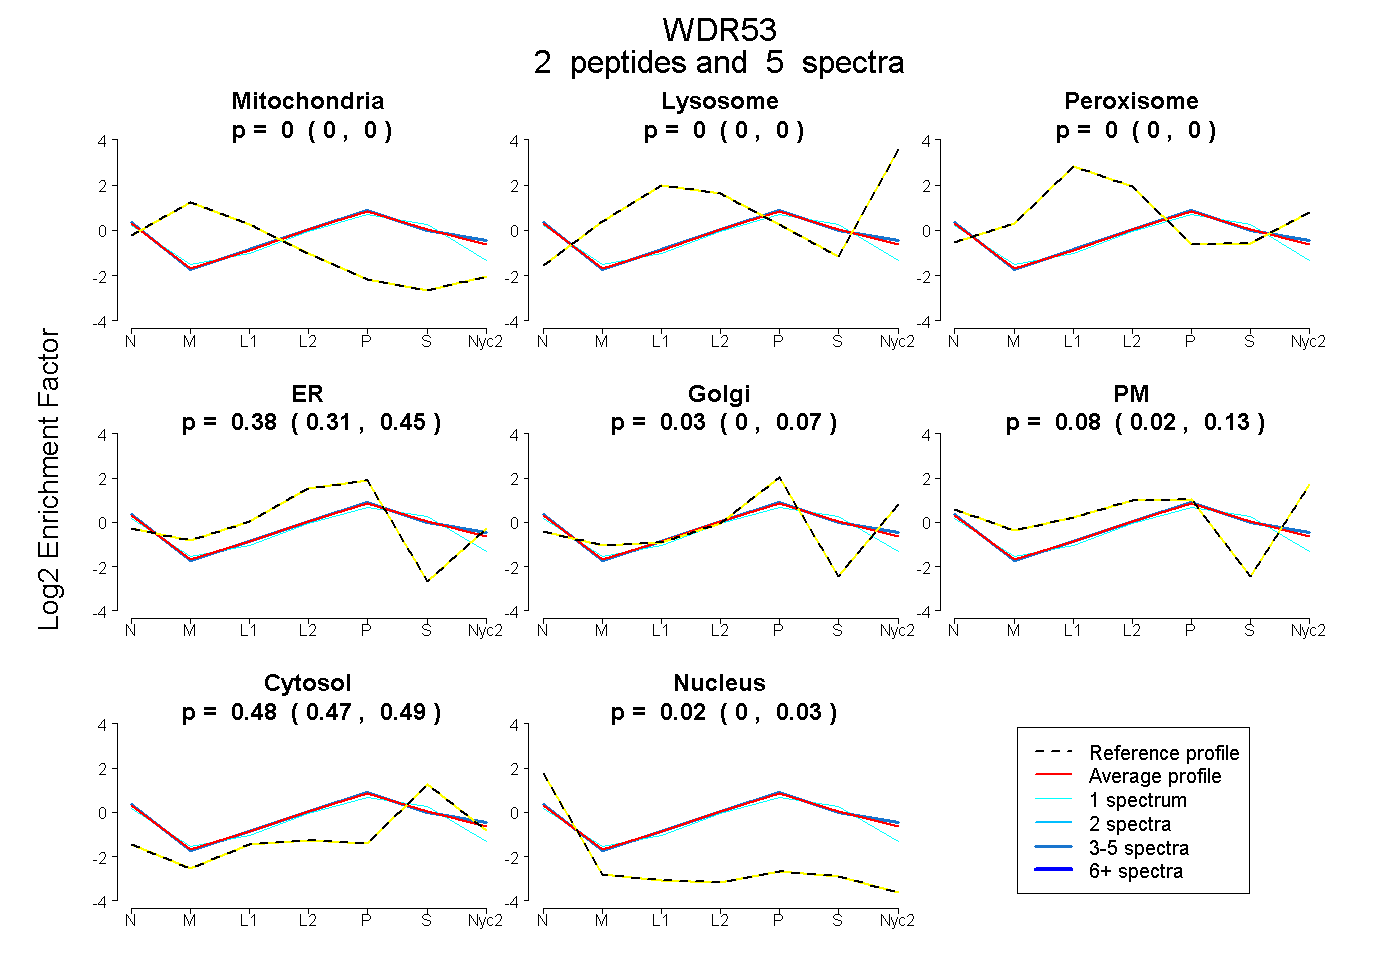
| Plot | Mito | Lyso | Perox | ER | Golgi | PM | Cytosol | Nucleus | |||||
| Expt A |
2 peptides |
5 spectra |
|
0.000 0.000 | 0.000 |
0.000 0.000 | 0.000 |
0.000 0.000 | 0.000 |
0.385 0.309 | 0.449 |
0.030 0.000 | 0.067 |
0.084 0.015 | 0.134 |
0.483 0.469 | 0.494 |
0.019 0.005 | 0.032 |
||
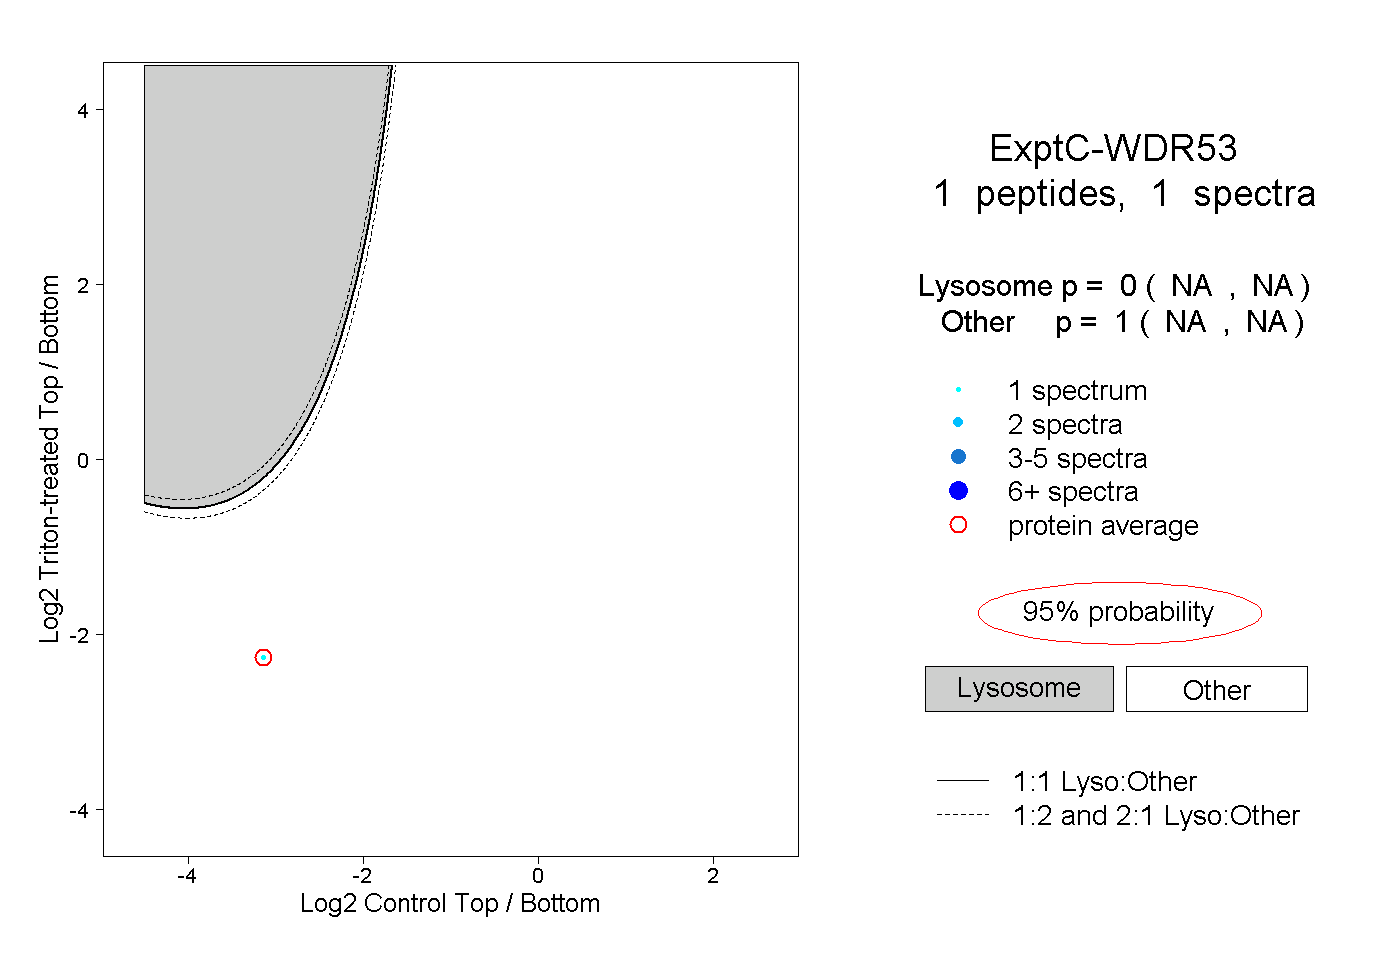
| Plot | Lyso | Other | |||||||||||
| Expt C |
1 peptide |
1 spectrum |
|
0.000 NA | NA |
1.000 NA | NA |