 3
3peptides
spectra
0.000 | 0.000
0.001 | 0.189
0.000 | 0.205
0.000 | 0.115
0.000 | 0.140
0.000 | 0.205
0.570 | 0.687
0.000 | 0.000
1peptide
spectrum
NA | NA
NA | NA
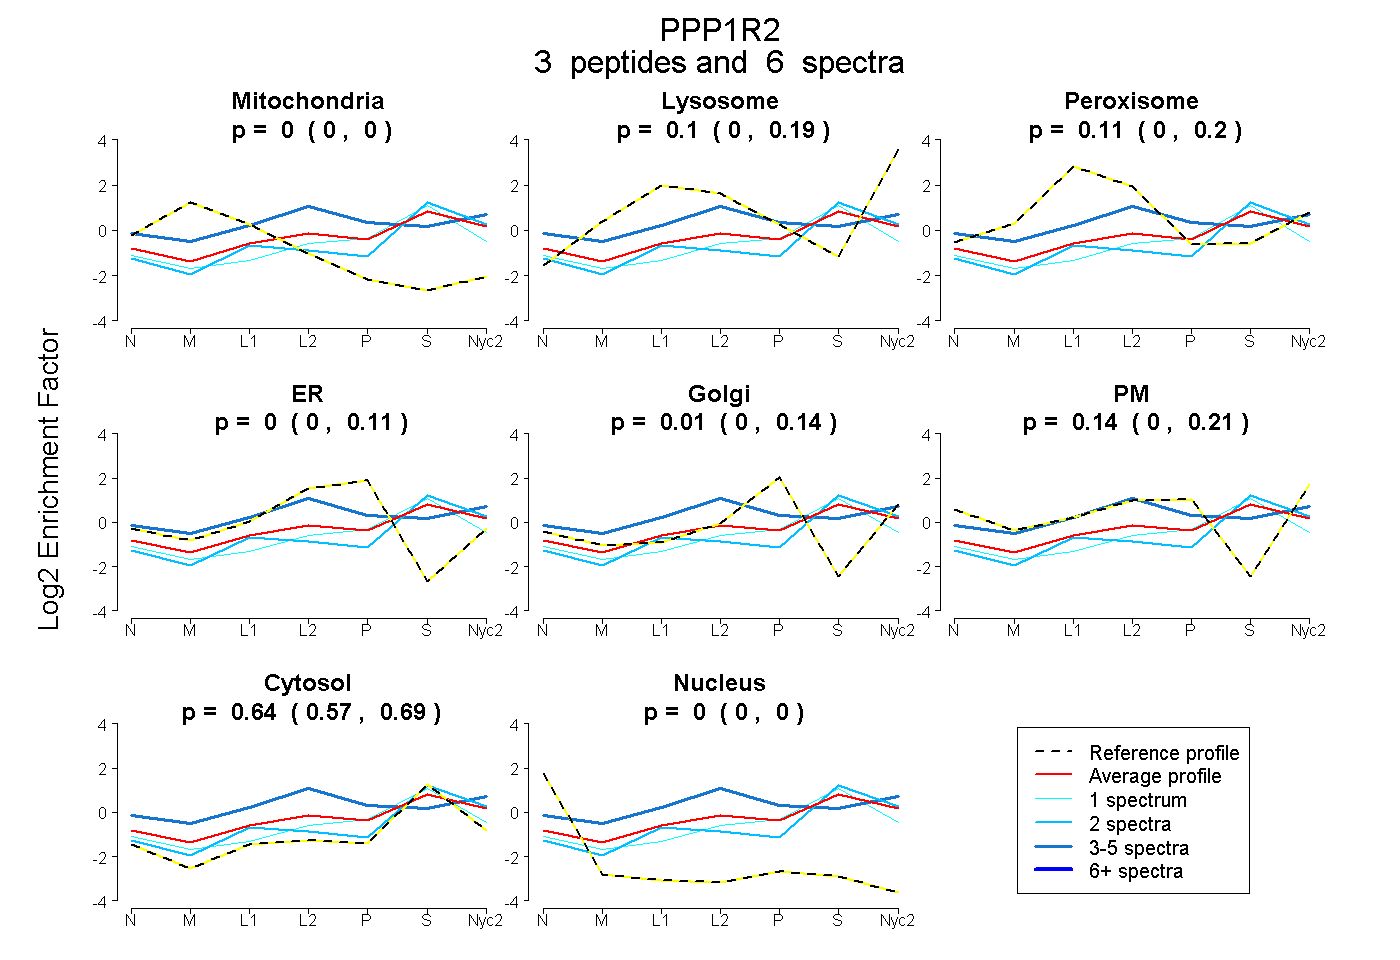
| Plot | Mito | Lyso | Perox | ER | Golgi | PM | Cytosol | Nucleus | |||||
| Expt A |
3 peptides |
6 spectra |
|
0.000 0.000 | 0.000 |
0.099 0.001 | 0.189 |
0.110 0.000 | 0.205 |
0.000 0.000 | 0.115 |
0.006 0.000 | 0.140 |
0.145 0.000 | 0.205 |
0.640 0.570 | 0.687 |
0.000 0.000 | 0.000 |
||
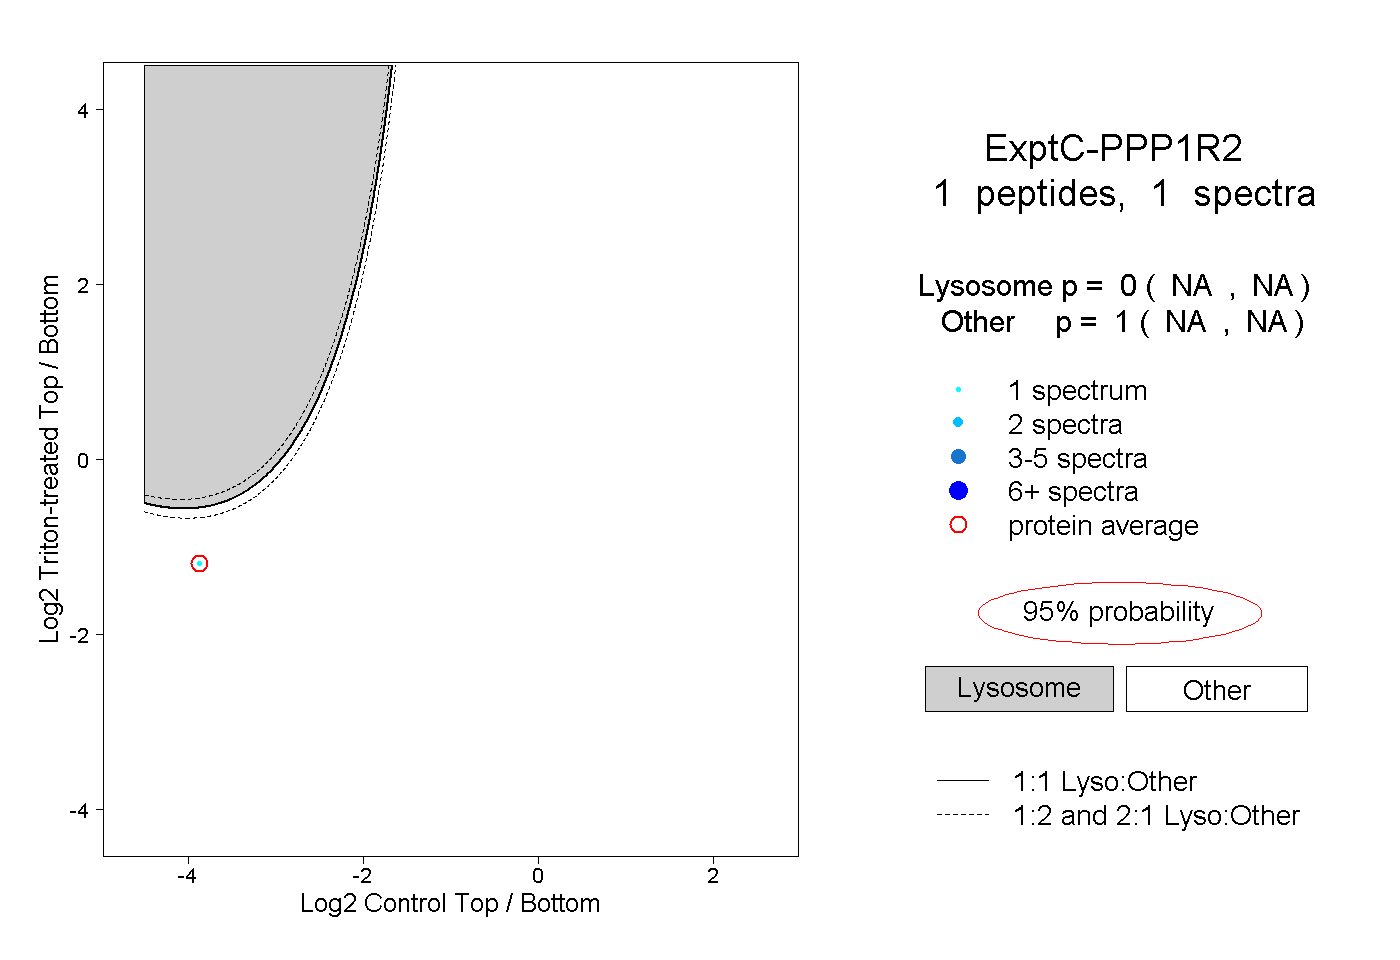
| Plot | Lyso | Other | |||||||||||
| Expt C |
1 peptide |
1 spectrum |
|
0.000 NA | NA |
1.000 NA | NA |