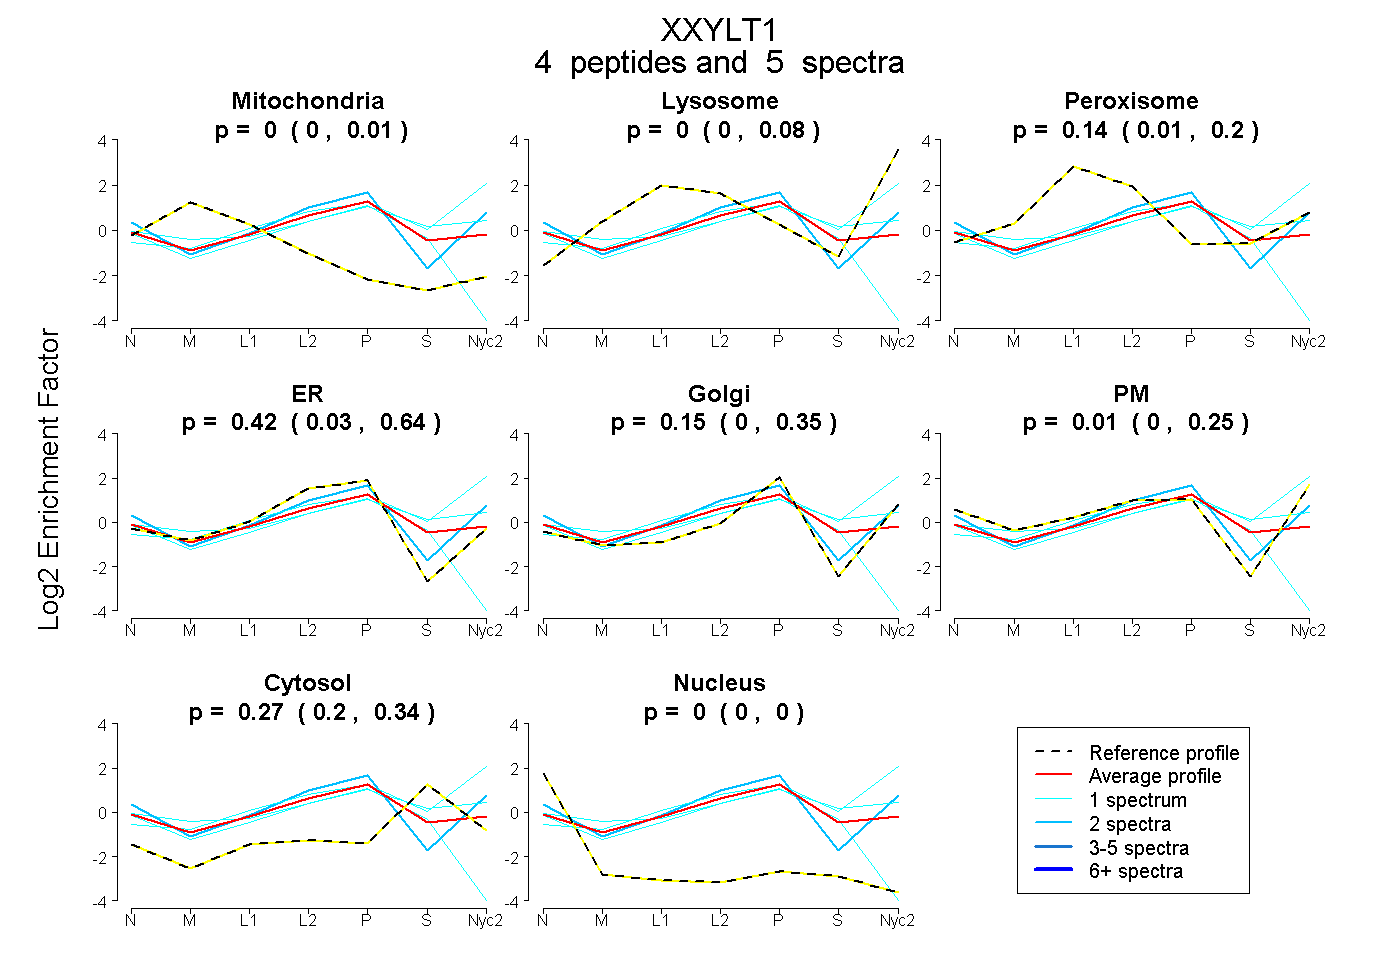
 4
4peptides
spectra
0.000 | 0.005
0.000 | 0.082
0.009 | 0.196
0.031 | 0.637
0.000 | 0.352
0.000 | 0.246
0.200 | 0.342
0.000 | 0.000
| Plot | Mito | Lyso | Perox | ER | Golgi | PM | Cytosol | Nucleus | |||||
| Expt A |
4 peptides |
5 spectra |
|
0.000 0.000 | 0.005 |
0.000 0.000 | 0.082 |
0.141 0.009 | 0.196 |
0.421 0.031 | 0.637 |
0.153 0.000 | 0.352 |
0.011 0.000 | 0.246 |
0.274 0.200 | 0.342 |
0.000 0.000 | 0.000 |
| 1 spectrum, QLCTWWR | 0.000 | 0.006 | 0.128 | 0.076 | 0.252 | 0.176 | 0.362 | 0.000 | ||
| 2 spectra, HTFWQFR | 0.000 | 0.000 | 0.000 | 0.332 | 0.139 | 0.438 | 0.091 | 0.000 | ||
| 1 spectrum, FEPHEVLNLHFVSEEASR | 0.209 | 0.000 | 0.000 | 0.461 | 0.000 | 0.000 | 0.233 | 0.098 | ||
| 1 spectrum, VIFHDVAVLTDK | 0.000 | 0.447 | 0.000 | 0.000 | 0.273 | 0.060 | 0.220 | 0.000 |