 4
4peptides
spectra
0.028 | 0.148
0.000 | 0.000
0.000 | 0.036
0.719 | 0.909
0.000 | 0.000
0.000 | 0.182
0.000 | 0.000
0.000 | 0.000
| Plot | Mito | Lyso | Perox | ER | Golgi | PM | Cytosol | Nucleus | |||||
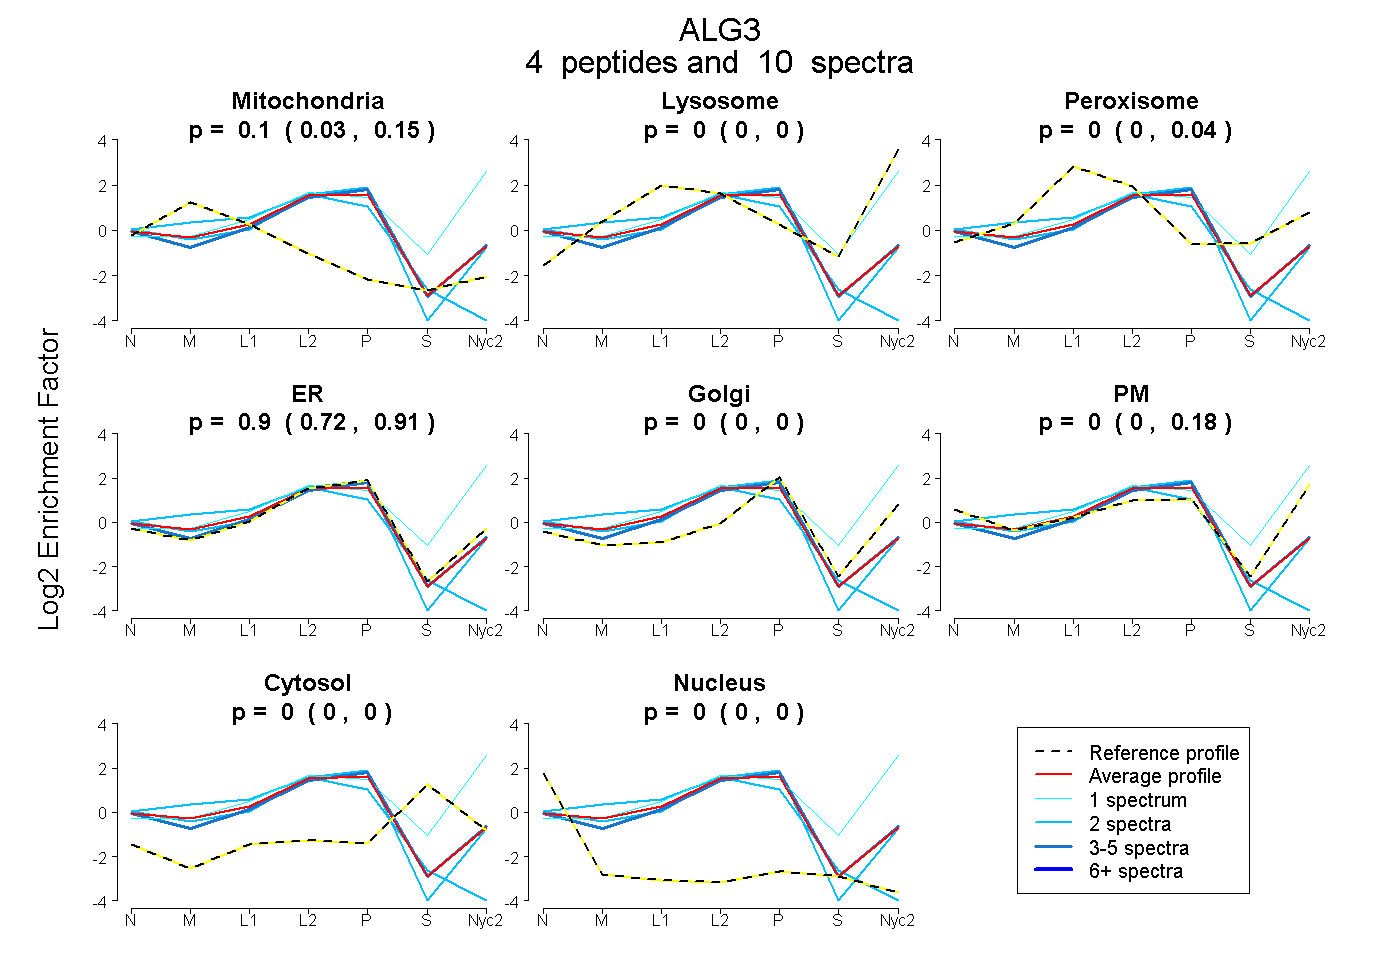
| Expt A |
4 peptides |
10 spectra |
|
0.104 0.028 | 0.148 |
0.000 0.000 | 0.000 |
0.000 0.000 | 0.036 |
0.896 0.719 | 0.909 |
0.000 0.000 | 0.000 |
0.000 0.000 | 0.182 |
0.000 0.000 | 0.000 |
0.000 0.000 | 0.000 |
| 5 spectra, SVQPSR | 0.030 | 0.000 | 0.000 | 0.950 | 0.000 | 0.000 | 0.000 | 0.021 | ||
| 1 spectrum, VHSIFVLR | 0.000 | 0.462 | 0.000 | 0.038 | 0.156 | 0.344 | 0.000 | 0.000 | ||
| 2 spectra, GLPGSVVQPAGIWK | 0.407 | 0.000 | 0.000 | 0.593 | 0.000 | 0.000 | 0.000 | 0.000 | ||
| 2 spectra, LLPEAIFLHR | 0.056 | 0.000 | 0.000 | 0.944 | 0.000 | 0.000 | 0.000 | 0.000 |
| Plot | Mito | Lyso or Perox | ER | Golgi | PM | Cytosol | Nucleus | ||||||
| Expt B |
3 peptides |
5 spectra |
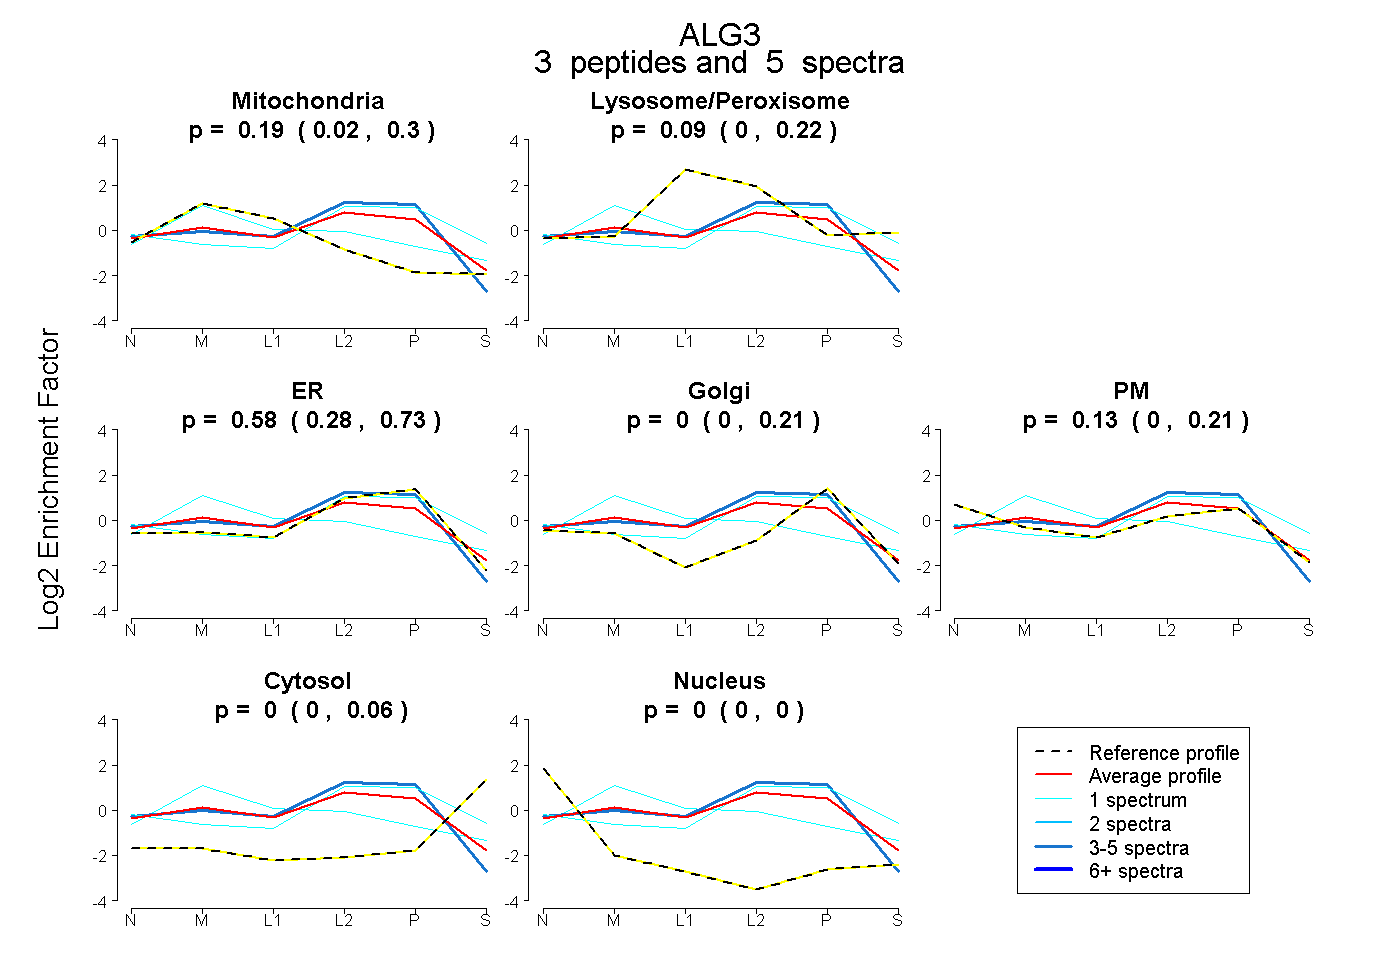 |
0.193 0.023 | 0.298 |
0.092 0.002 | 0.219 |
0.581 0.281 | 0.725 |
0.000 0.000 | 0.208 |
0.134 0.000 | 0.211 |
0.000 0.000 | 0.060 |
0.000 0.000 | 0.000 |
|||
| Plot | Lyso | Other | |||||||||||
| Expt C |
3 peptides |
10 spectra |
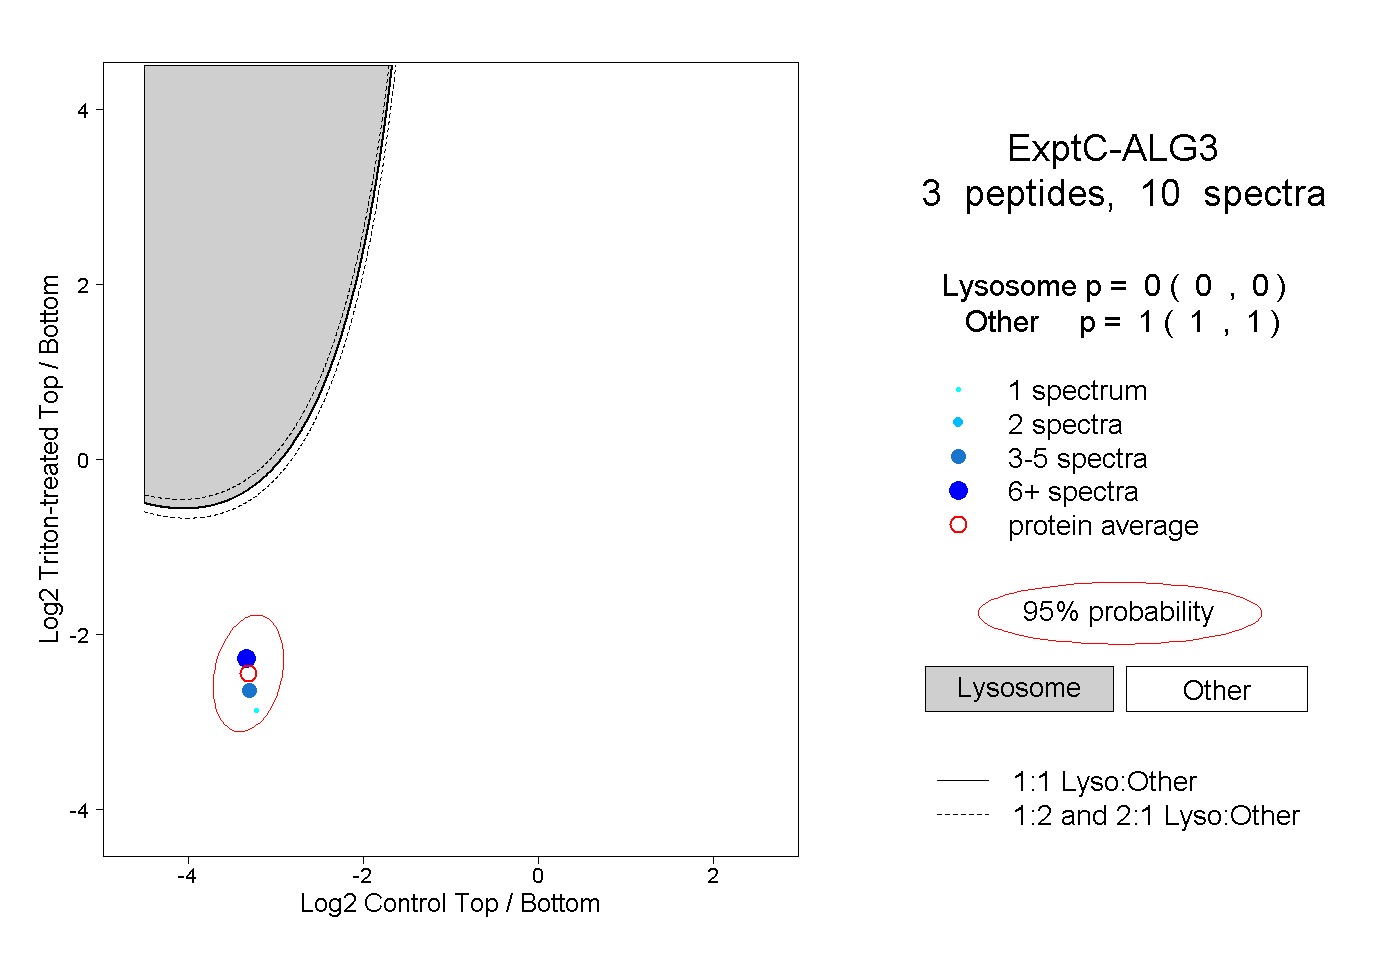 |
0.000 0.000 | 0.000 |
1.000 1.000 | 1.000 |