 14
14peptides
spectra
0.000 | 0.000
0.000 | 0.000
0.000 | 0.000
0.309 | 0.340
0.135 | 0.172
0.000 | 0.000
0.514 | 0.523
0.000 | 0.000
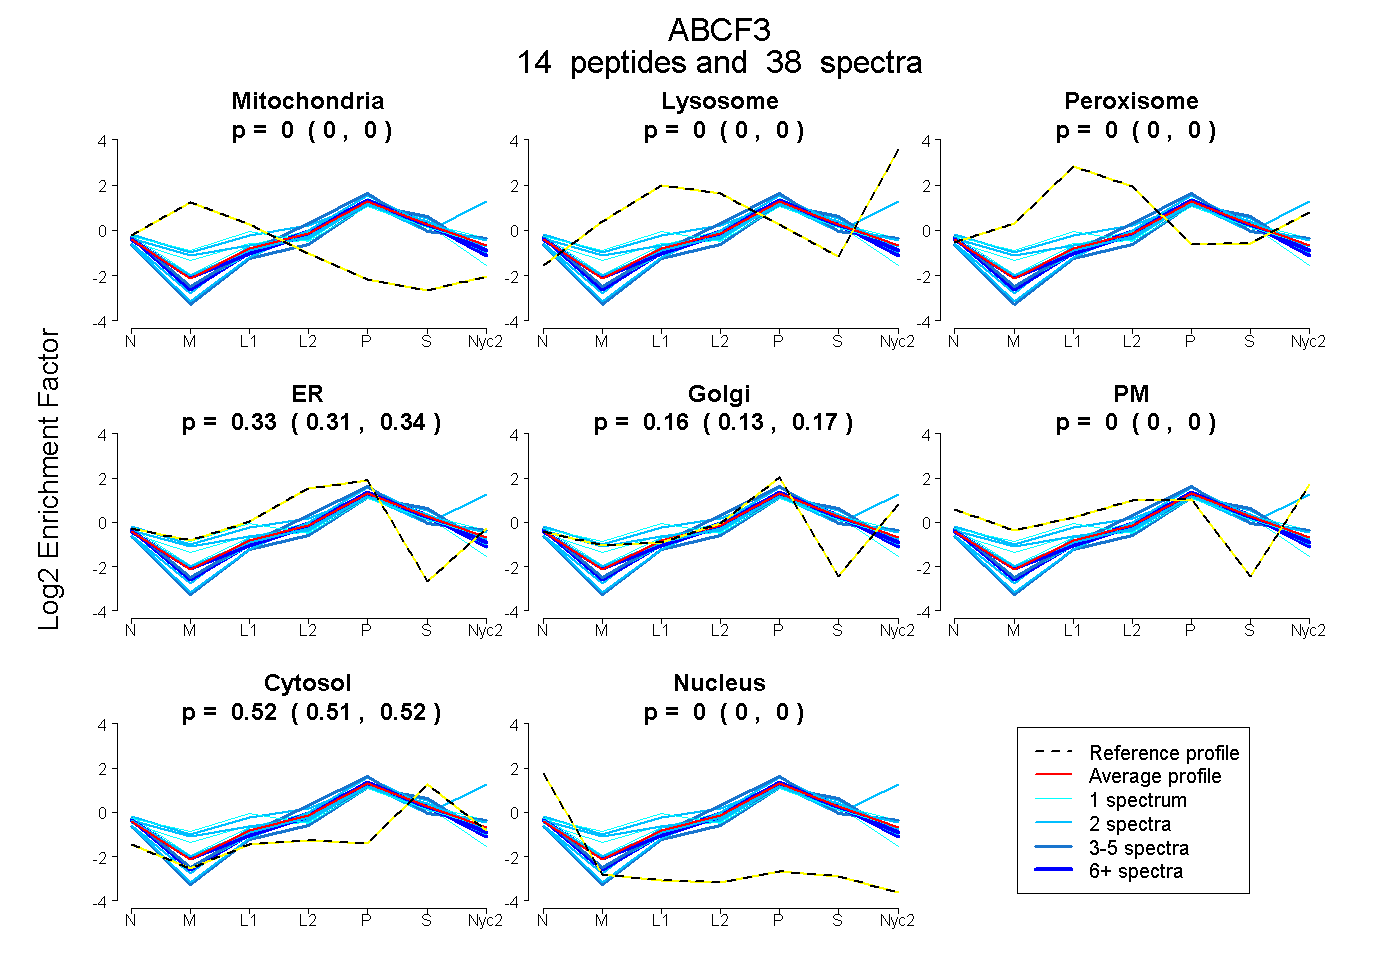
| Plot | Mito | Lyso | Perox | ER | Golgi | PM | Cytosol | Nucleus | |||||
| Expt A |
14 peptides |
38 spectra |
|
0.000 0.000 | 0.000 |
0.000 0.000 | 0.000 |
0.000 0.000 | 0.000 |
0.326 0.309 | 0.340 |
0.155 0.135 | 0.172 |
0.000 0.000 | 0.000 |
0.519 0.514 | 0.523 |
0.000 0.000 | 0.000 |
| 1 spectrum, ALFARPDLLLLDEPTNMLDVR | 0.000 | 0.000 | 0.000 | 0.414 | 0.031 | 0.000 | 0.556 | 0.000 | ||
| 3 spectra, EYEAQQQYR | 0.000 | 0.000 | 0.000 | 0.158 | 0.174 | 0.000 | 0.668 | 0.000 | ||
| 2 spectra, ELWVCEK | 0.000 | 0.000 | 0.000 | 0.302 | 0.099 | 0.000 | 0.599 | 0.000 | ||
| 2 spectra, VEGGFDQYR | 0.000 | 0.000 | 0.000 | 0.301 | 0.159 | 0.000 | 0.540 | 0.000 | ||
| 2 spectra, LLMGDLAPVR | 0.000 | 0.000 | 0.000 | 0.330 | 0.110 | 0.000 | 0.560 | 0.000 | ||
| 7 spectra, HLIFSR | 0.000 | 0.000 | 0.000 | 0.420 | 0.021 | 0.000 | 0.559 | 0.000 | ||
| 4 spectra, LLNQQR | 0.000 | 0.000 | 0.000 | 0.340 | 0.227 | 0.000 | 0.433 | 0.000 | ||
| 1 spectrum, ALLQEQFR | 0.000 | 0.000 | 0.000 | 0.459 | 0.000 | 0.000 | 0.541 | 0.000 | ||
| 2 spectra, EFSGGWR | 0.000 | 0.204 | 0.000 | 0.000 | 0.261 | 0.231 | 0.304 | 0.000 | ||
| 9 spectra, MQQQPTR | 0.000 | 0.000 | 0.000 | 0.335 | 0.143 | 0.000 | 0.521 | 0.000 | ||
| 1 spectrum, GDFETFIK | 0.000 | 0.000 | 0.000 | 0.355 | 0.140 | 0.000 | 0.506 | 0.000 | ||
| 2 spectra, LSVSADLESR | 0.000 | 0.000 | 0.059 | 0.220 | 0.283 | 0.000 | 0.438 | 0.000 | ||
| 1 spectrum, IENFDVSFGDR | 0.000 | 0.000 | 0.000 | 0.288 | 0.180 | 0.000 | 0.532 | 0.000 | ||
| 1 spectrum, TSSPLVLEEASASQAGSR | 0.005 | 0.000 | 0.148 | 0.185 | 0.249 | 0.000 | 0.412 | 0.000 |
| Plot | Mito | Lyso or Perox | ER | Golgi | PM | Cytosol | Nucleus | ||||||
| Expt B |
4 peptides |
6 spectra |
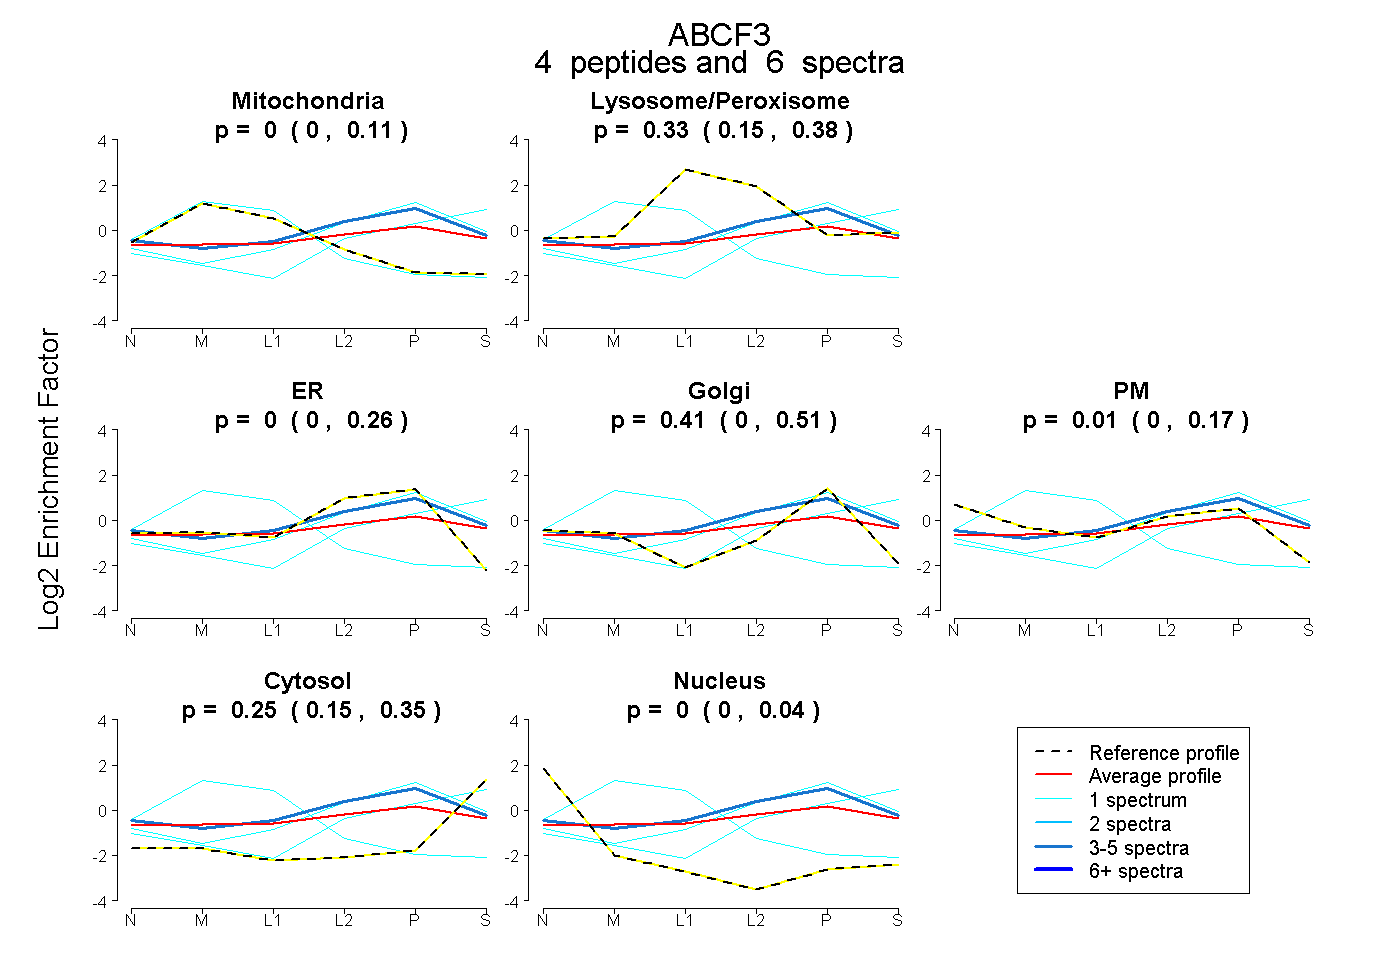 |
0.000 0.000 | 0.110 |
0.331 0.149 | 0.379 |
0.000 0.000 | 0.261 |
0.414 0.000 | 0.506 |
0.009 0.000 | 0.174 |
0.246 0.145 | 0.352 |
0.000 0.000 | 0.037 |
|||
| Plot | Lyso | Other | |||||||||||
| Expt C |
10 peptides |
25 spectra |
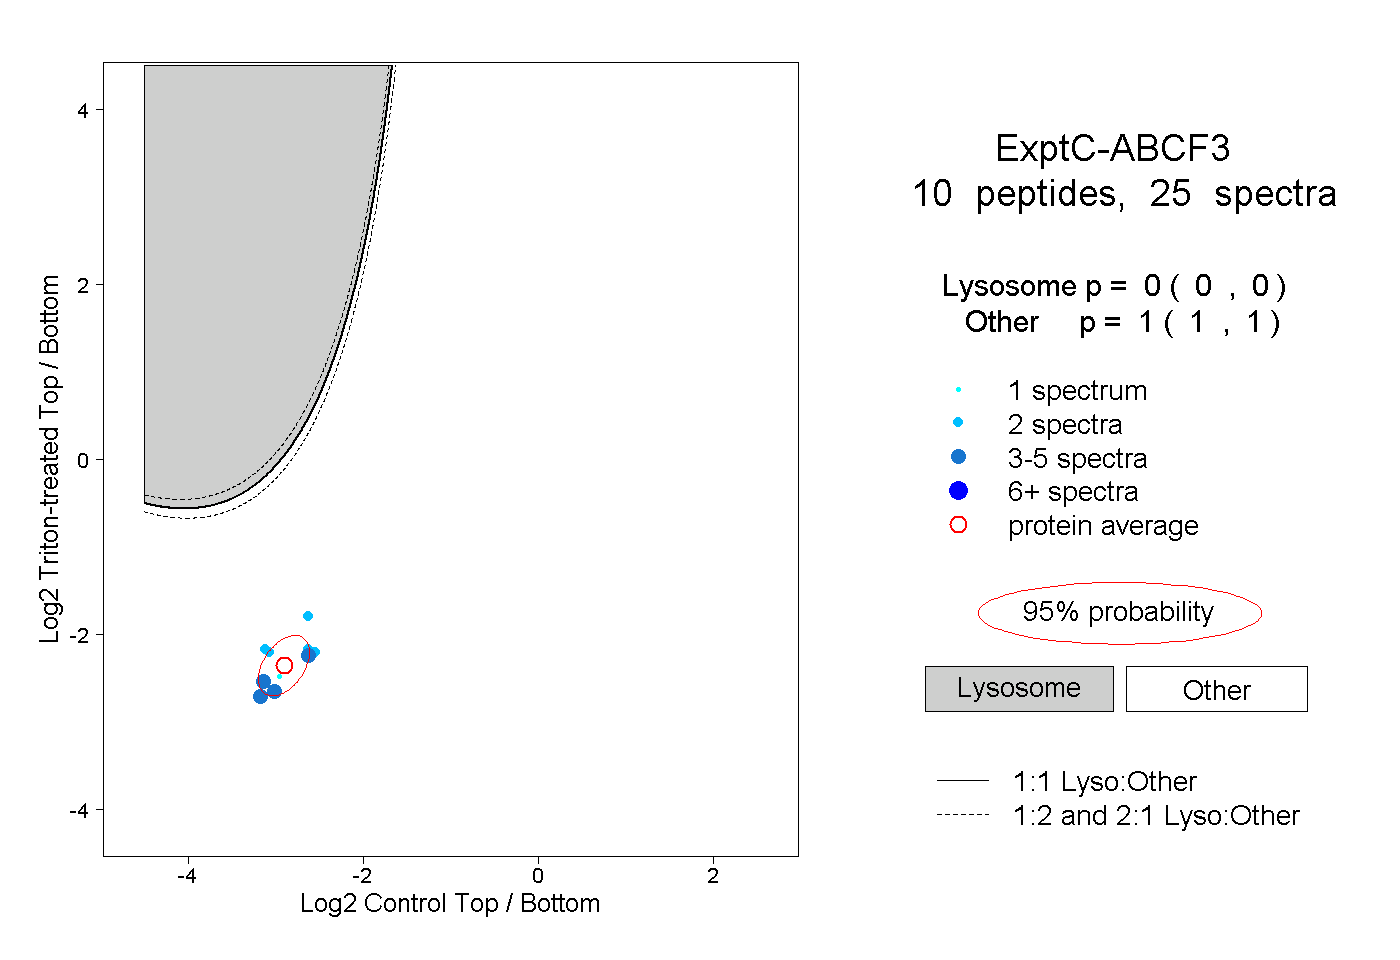 |
0.000 0.000 | 0.000 |
1.000 1.000 | 1.000 |
||||||||
| Plot | Lyso | Other | |||||||||||
| Expt D |
3 peptides |
4 spectra |
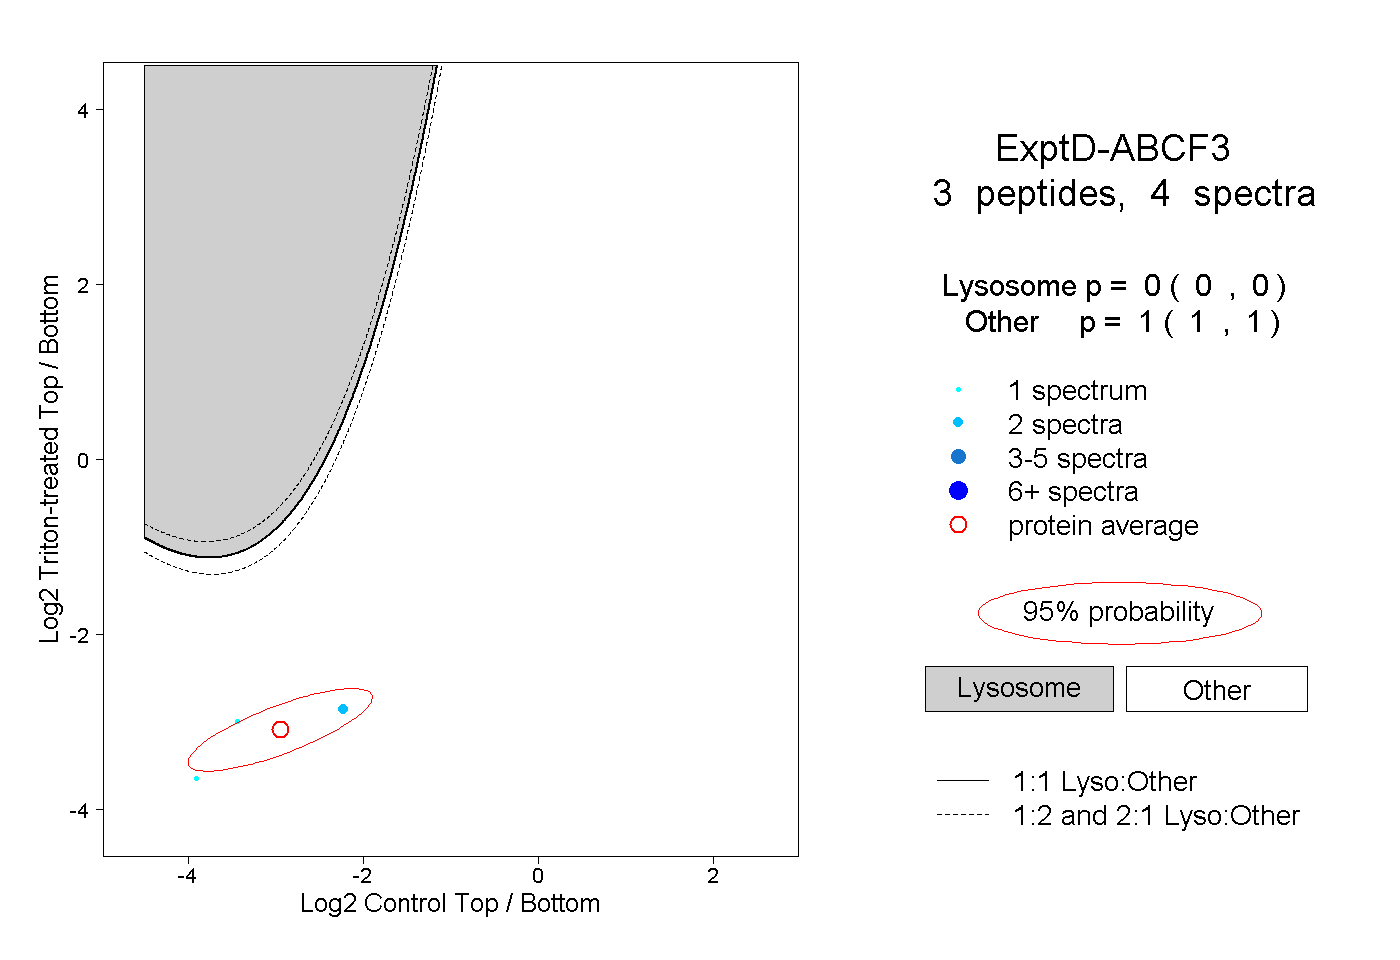 |
0.000 0.000 | 0.000 |
1.000 1.000 | 1.000 |