13
13peptides
spectra
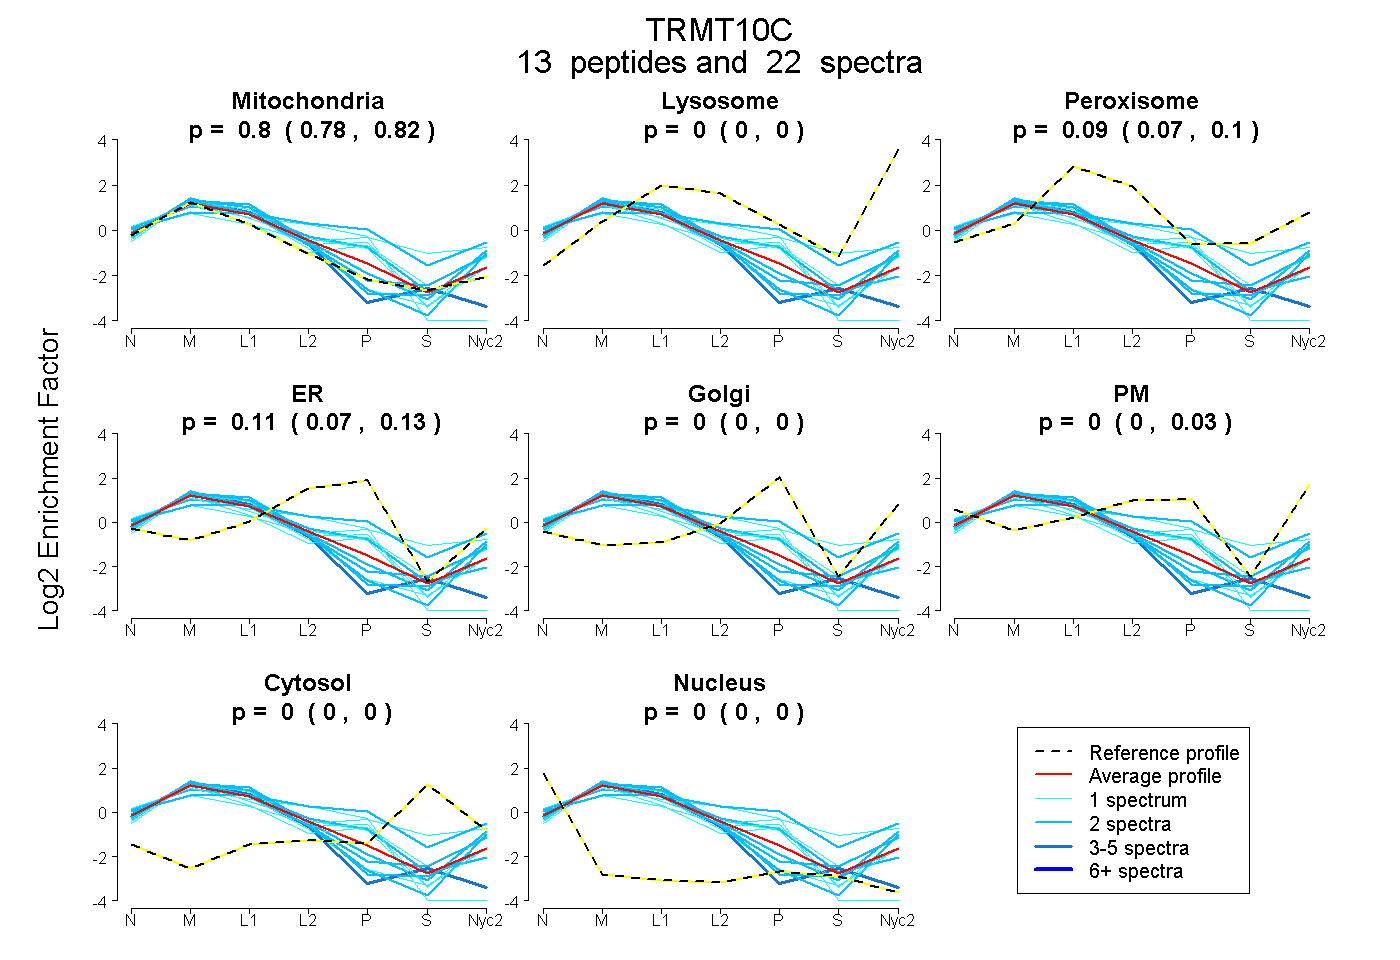
0.785 | 0.820
0.000 | 0.000
0.071 | 0.102
0.066 | 0.126
0.000 | 0.000
0.000 | 0.032
0.000 | 0.000
0.000 | 0.000
4peptides
spectra
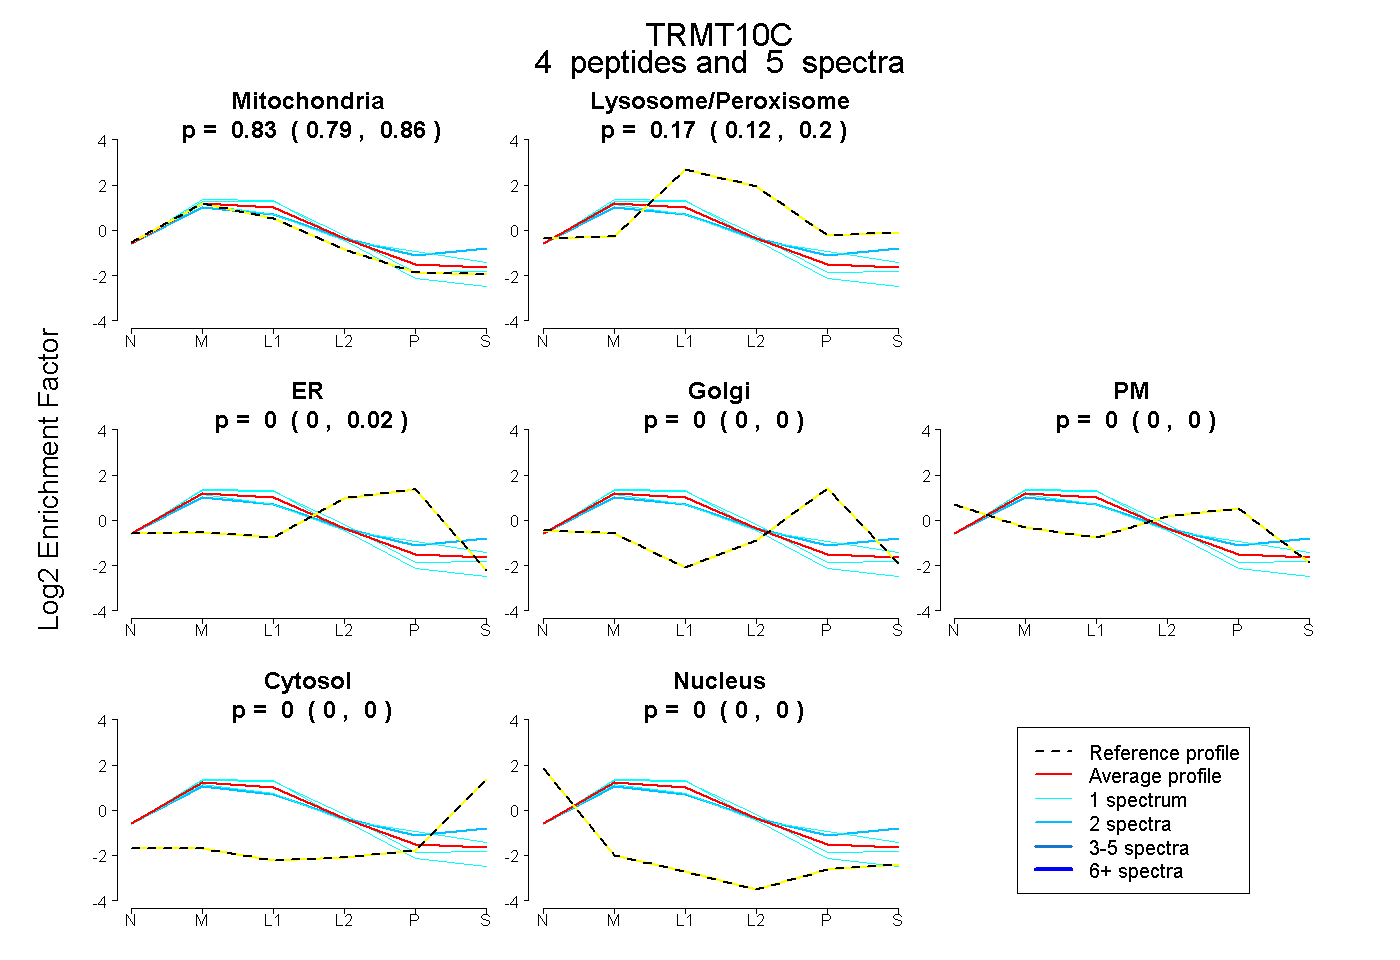
0.792 | 0.865
0.124 | 0.197
0.000 | 0.025
0.000 | 0.000
0.000 | 0.000
0.000 | 0.001
0.000 | 0.000
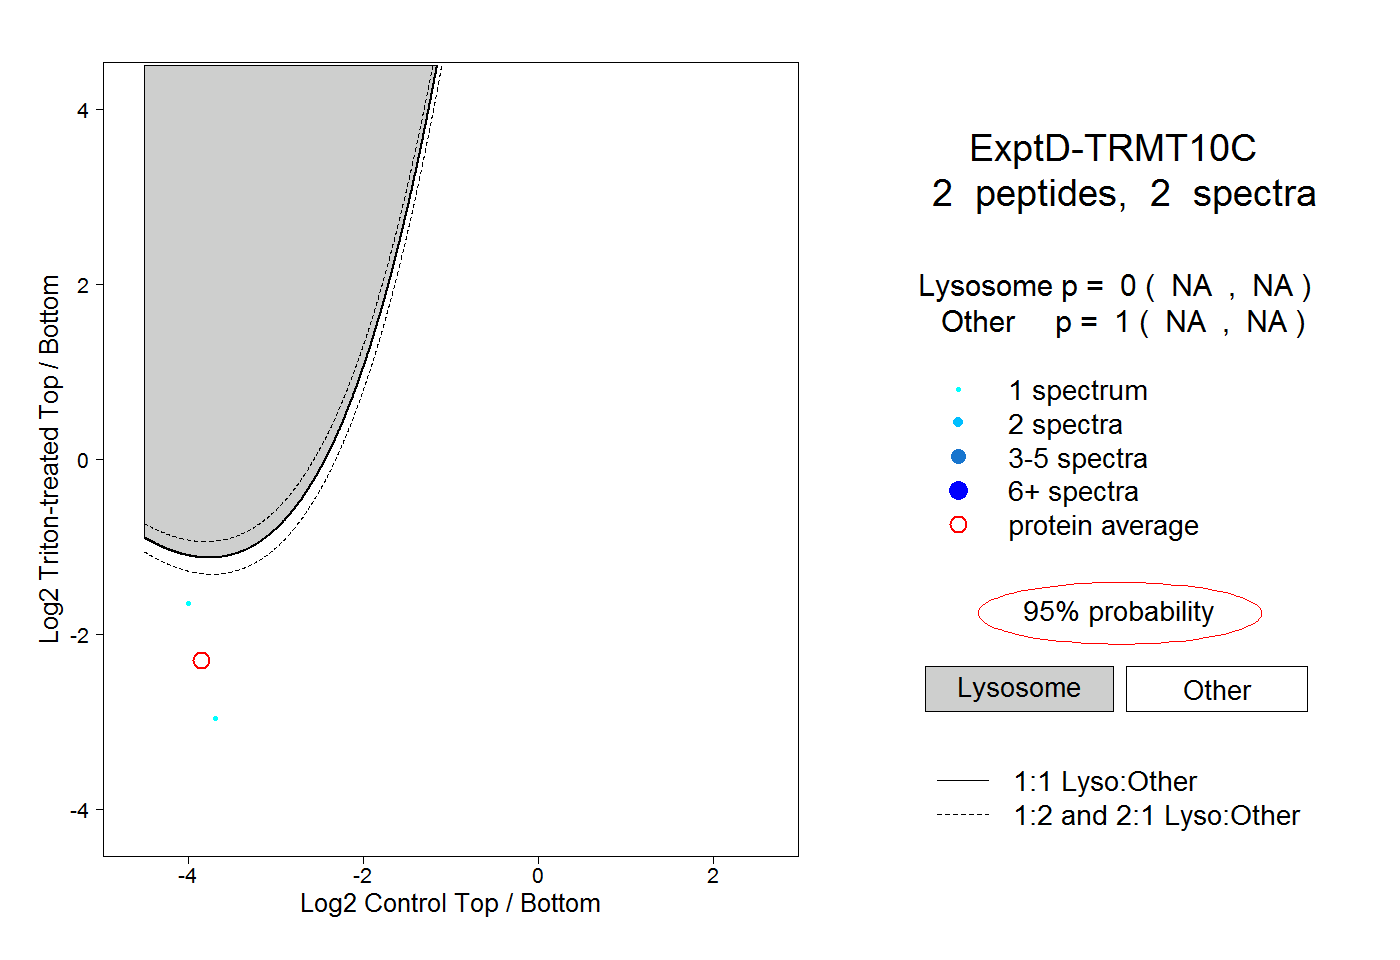
17peptides
spectra
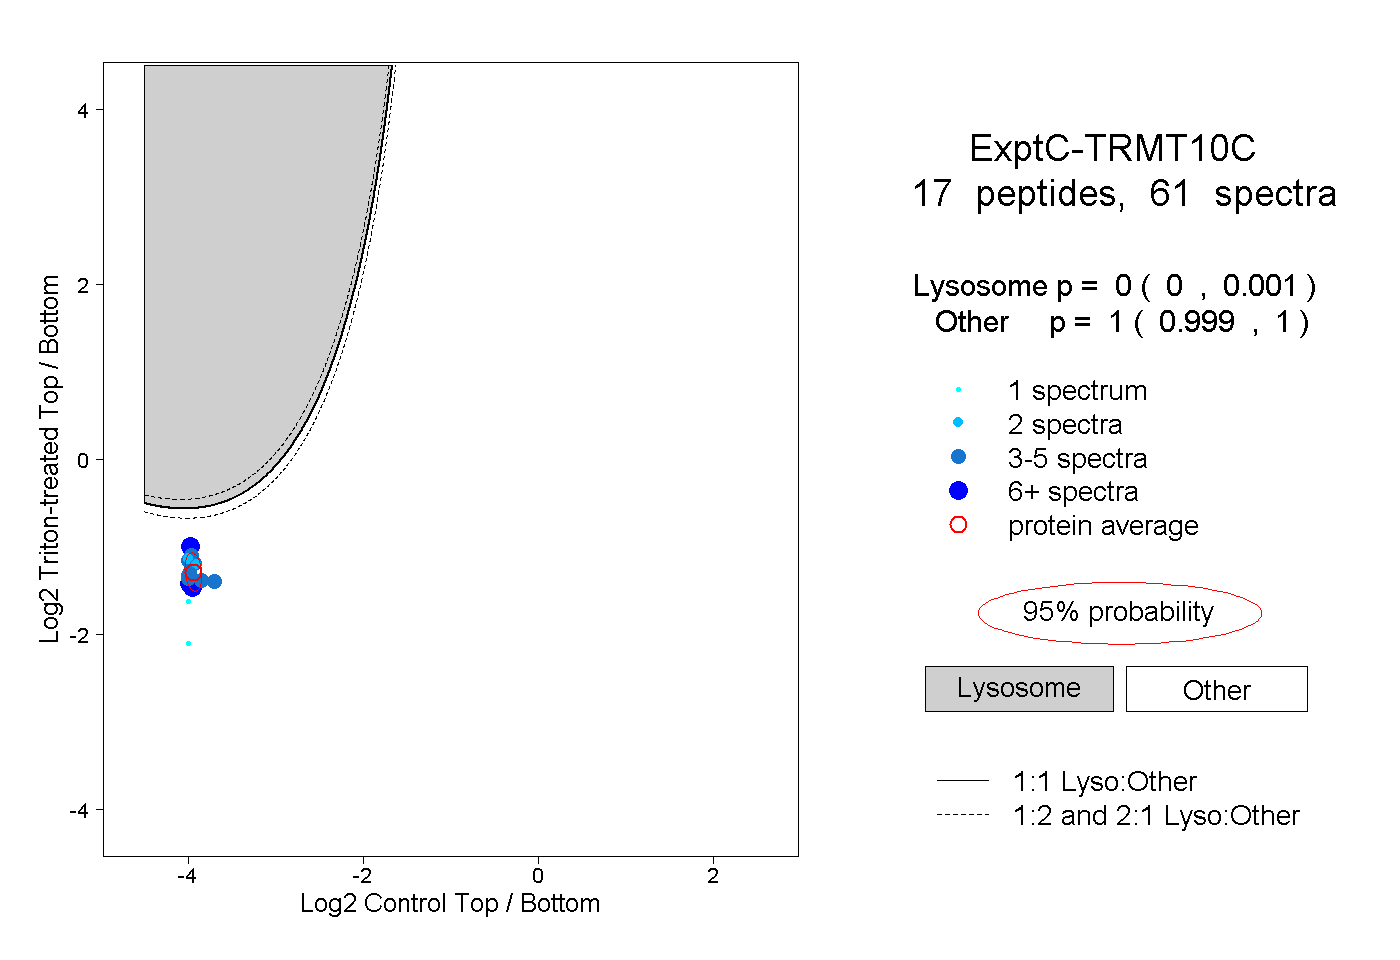
0.000 | 0.001
0.999 | 1.000