TRMT10C
[ENSRNOP00000002198]
Main page
| | | Plot |
Mito |
Lyso |
|
Perox |
ER |
Golgi |
PM |
Cytosol |
Nucleus |
|
| Expt A |
 13
13
peptides |
22
spectra |
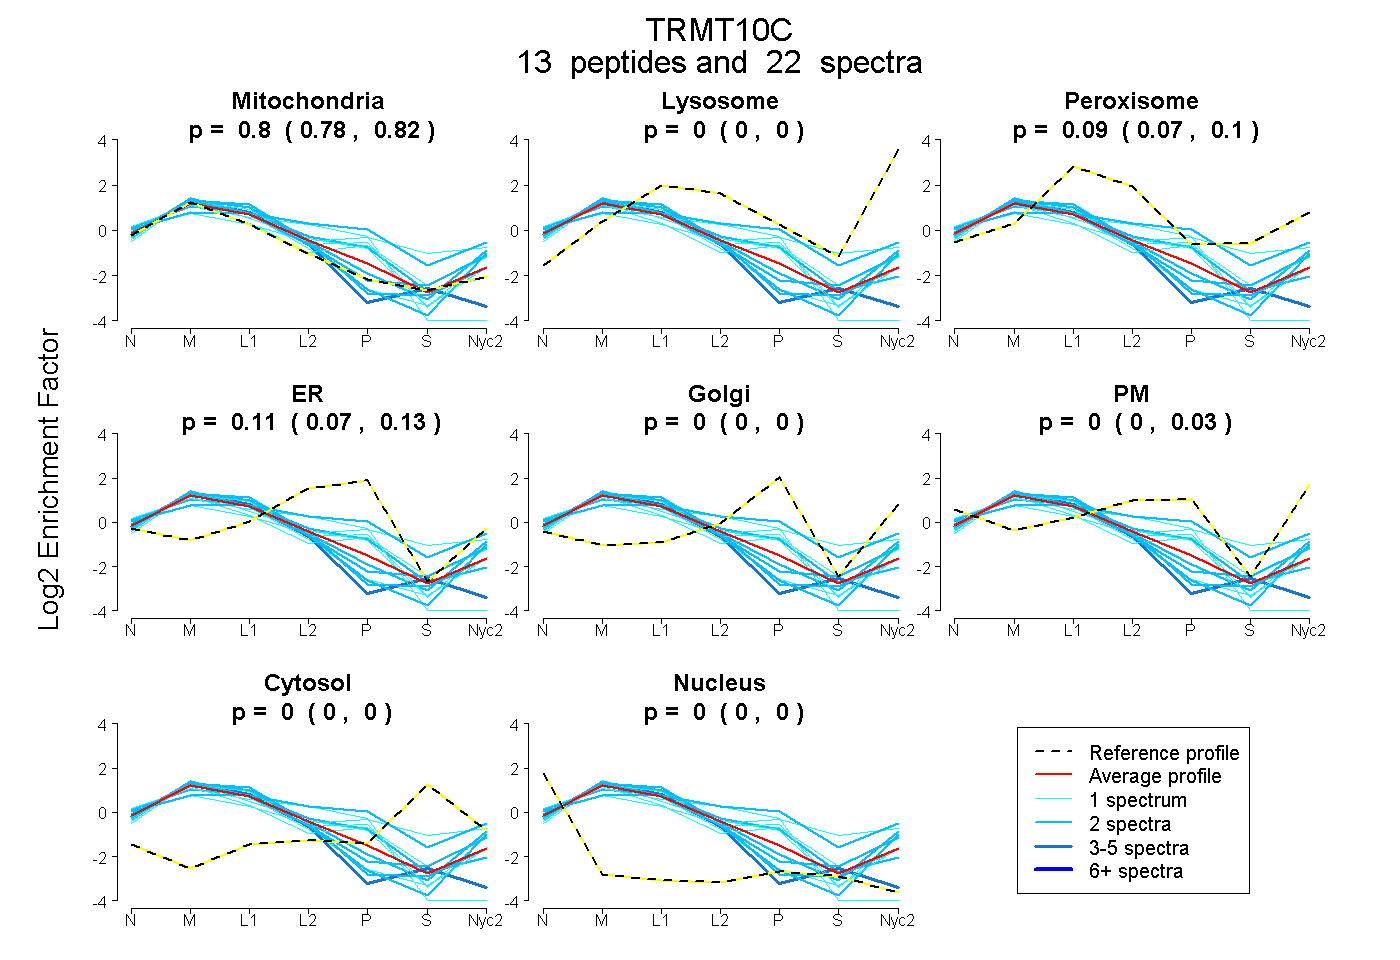 |
0.803
0.785 | 0.820 |
0.000
0.000 | 0.000 |
|
0.090
0.071 | 0.102 |
0.106
0.066 | 0.126 |
0.000
0.000 | 0.000 |
0.000
0.000 | 0.032 |
0.000
0.000 | 0.000 |
0.000
0.000 | 0.000 |
|
| | | Plot |
Mito |
|
Lyso or Perox |
|
ER |
Golgi |
PM |
Cytosol |
Nucleus |
|
| Expt B |
4
peptides |
5
spectra |
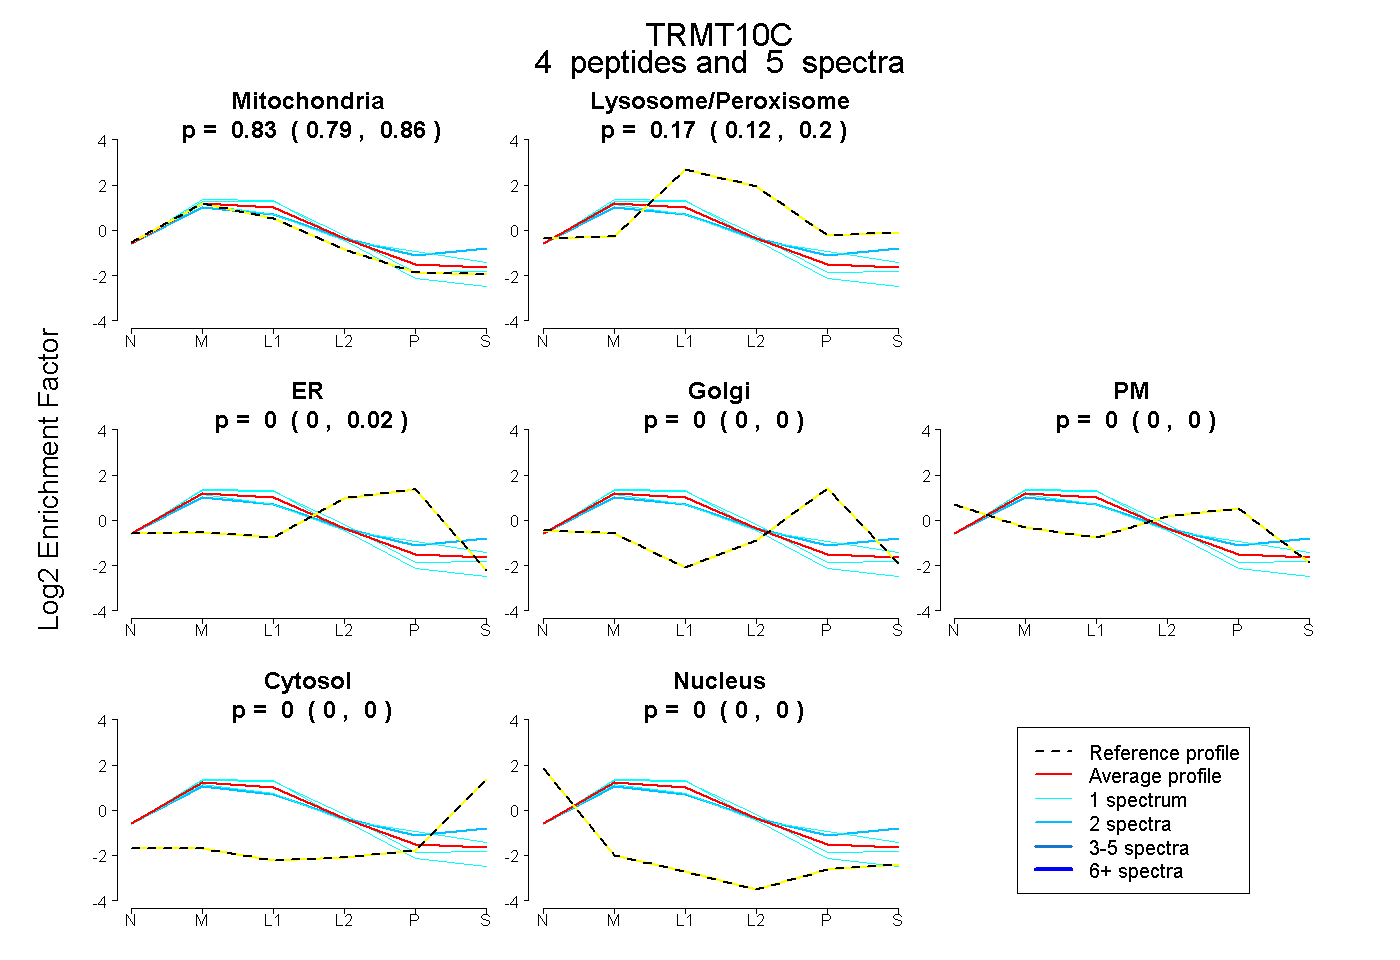 |
0.834
0.792 | 0.865 |
|
0.166
0.124 | 0.197 |
|
0.000
0.000 | 0.025 |
0.000
0.000 | 0.000 |
0.000
0.000 | 0.000 |
0.000
0.000 | 0.001 |
0.000
0.000 | 0.000 |
|
| 1 spectrum, LLLTATEK |
0.715 |
|
0.180 |
|
0.000 |
0.106 |
0.000 |
0.000 |
0.000 |
|
| 2 spectra, IYIIGSFVDK |
0.635 |
|
0.247 |
|
0.000 |
0.024 |
0.000 |
0.093 |
0.000 |
|
| 1 spectrum, ILLCLK |
0.837 |
|
0.163 |
|
0.000 |
0.000 |
0.000 |
0.000 |
0.000 |
|
| 1 spectrum, EVPEHITEEELK |
0.952 |
|
0.048 |
|
0.000 |
0.000 |
0.000 |
0.000 |
0.000 |
|
| | | Plot |
|
Lyso |
|
|
|
|
|
|
|
Other |
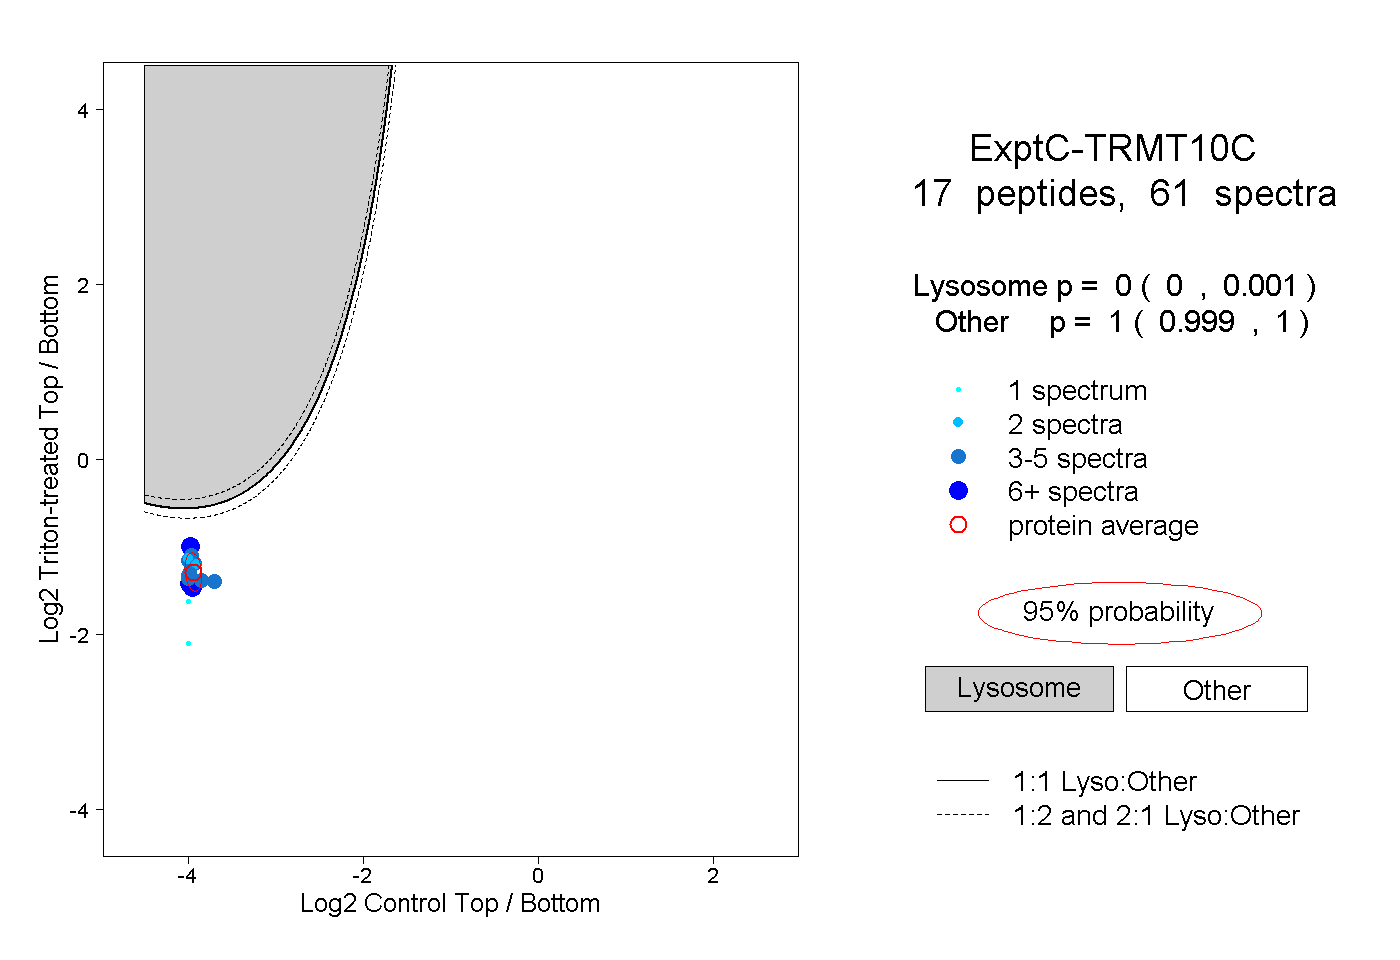
| Expt C |
17
peptides |
61
spectra |
 |
|
0.000
0.000 | 0.001 |
|
|
|
|
|
|
|
1.000
0.999 | 1.000 |
| | | Plot |
|
Lyso |
|
|
|
|
|
|
|
Other |
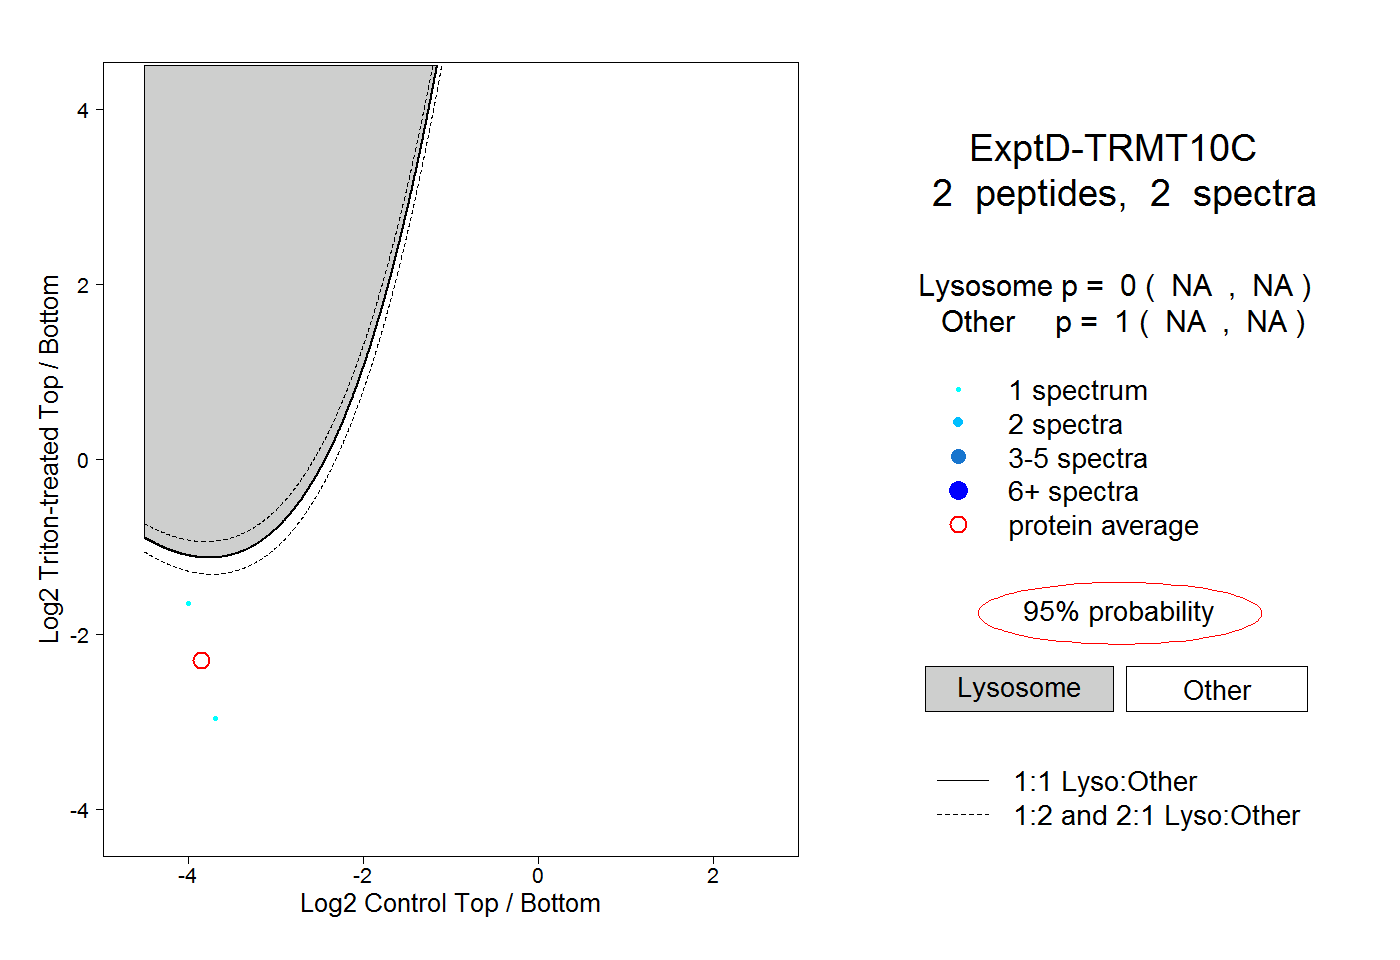
| Expt D |
2
peptides |
2
spectra |
 |
|
0.000
NA | NA |
|
|
|
|
|
|
|
1.000
NA | NA |