 13
13peptides
spectra
0.785 | 0.820
0.000 | 0.000
0.071 | 0.102
0.066 | 0.126
0.000 | 0.000
0.000 | 0.032
0.000 | 0.000
0.000 | 0.000
| Plot | Mito | Lyso | Perox | ER | Golgi | PM | Cytosol | Nucleus | |||||
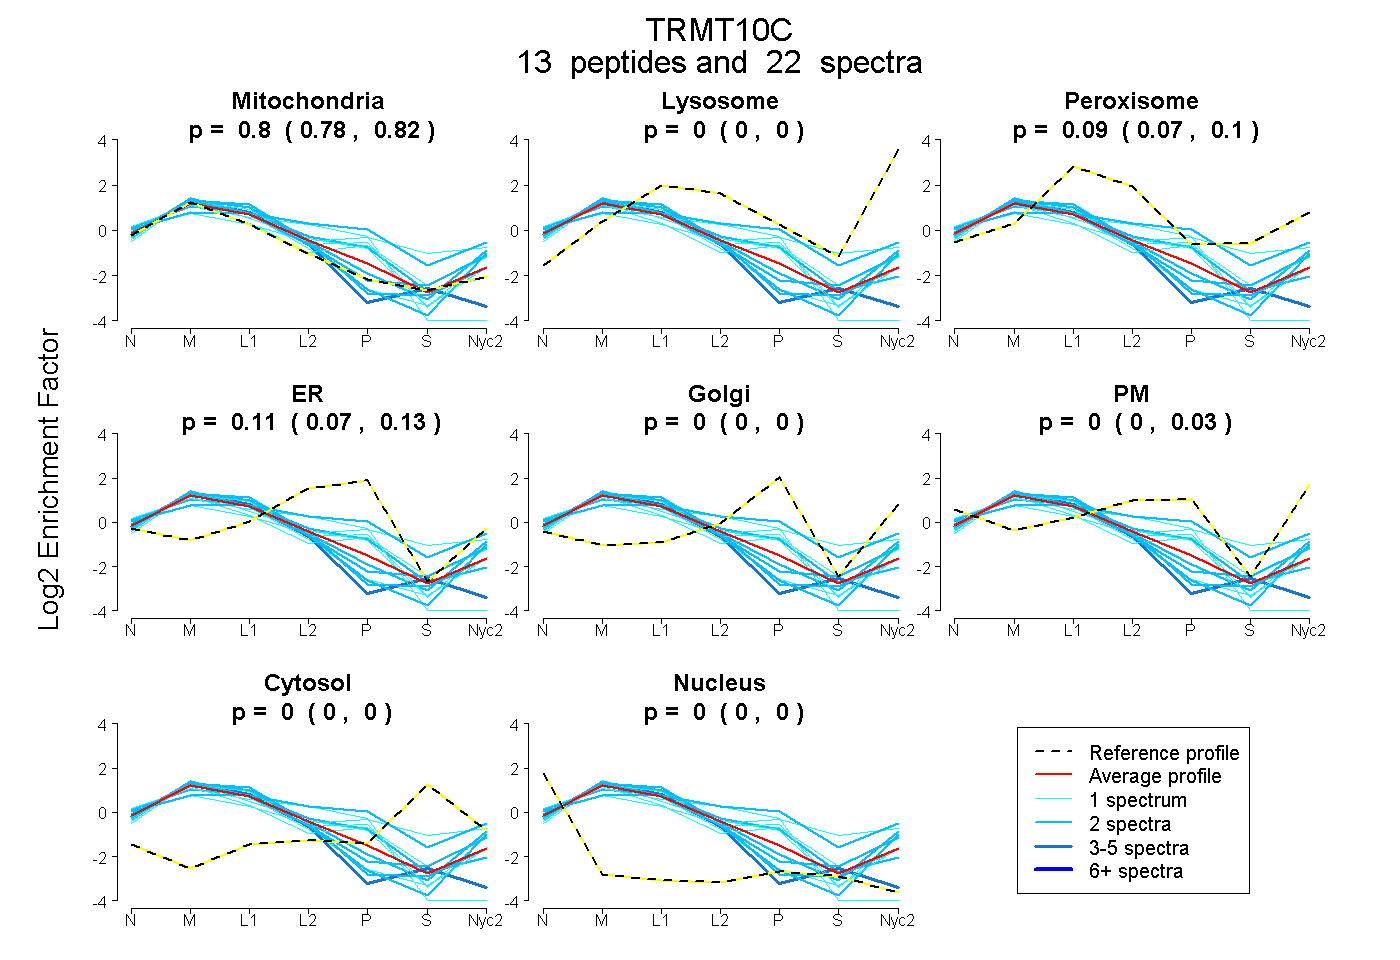
| Expt A |
13 peptides |
22 spectra |
|
0.803 0.785 | 0.820 |
0.000 0.000 | 0.000 |
0.090 0.071 | 0.102 |
0.106 0.066 | 0.126 |
0.000 0.000 | 0.000 |
0.000 0.000 | 0.032 |
0.000 0.000 | 0.000 |
0.000 0.000 | 0.000 |
| 1 spectrum, TLMECASK | 0.725 | 0.004 | 0.000 | 0.271 | 0.000 | 0.000 | 0.000 | 0.000 | ||
| 4 spectra, ILLCLK | 1.000 | 0.000 | 0.000 | 0.000 | 0.000 | 0.000 | 0.000 | 0.000 | ||
| 1 spectrum, TLNSFR | 0.445 | 0.000 | 0.213 | 0.000 | 0.227 | 0.001 | 0.113 | 0.000 | ||
| 2 spectra, SLEPSTGEEQR | 0.888 | 0.000 | 0.112 | 0.000 | 0.000 | 0.000 | 0.000 | 0.000 | ||
| 1 spectrum, NLTLDQMIR | 0.708 | 0.062 | 0.000 | 0.202 | 0.000 | 0.027 | 0.000 | 0.000 | ||
| 2 spectra, VPSLPCHNK | 0.372 | 0.000 | 0.297 | 0.113 | 0.179 | 0.039 | 0.000 | 0.000 | ||
| 2 spectra, QTNIALGWK | 0.907 | 0.093 | 0.000 | 0.000 | 0.000 | 0.000 | 0.000 | 0.000 | ||
| 1 spectrum, IYIIGSFVDK | 0.717 | 0.014 | 0.020 | 0.000 | 0.225 | 0.024 | 0.000 | 0.000 | ||
| 1 spectrum, QNLATECLPLDK | 0.729 | 0.000 | 0.000 | 0.259 | 0.000 | 0.000 | 0.000 | 0.013 | ||
| 2 spectra, YLQWDVGNK | 0.846 | 0.102 | 0.052 | 0.000 | 0.000 | 0.000 | 0.000 | 0.000 | ||
| 2 spectra, ELIEMWR | 0.823 | 0.177 | 0.000 | 0.000 | 0.000 | 0.000 | 0.000 | 0.000 | ||
| 1 spectrum, DFMFLR | 0.968 | 0.032 | 0.000 | 0.000 | 0.000 | 0.000 | 0.000 | 0.000 | ||
| 2 spectra, HTGYLEVPEHSQAAFR | 0.733 | 0.000 | 0.026 | 0.242 | 0.000 | 0.000 | 0.000 | 0.000 |
| Plot | Mito | Lyso or Perox | ER | Golgi | PM | Cytosol | Nucleus | ||||||
| Expt B |
4 peptides |
5 spectra |
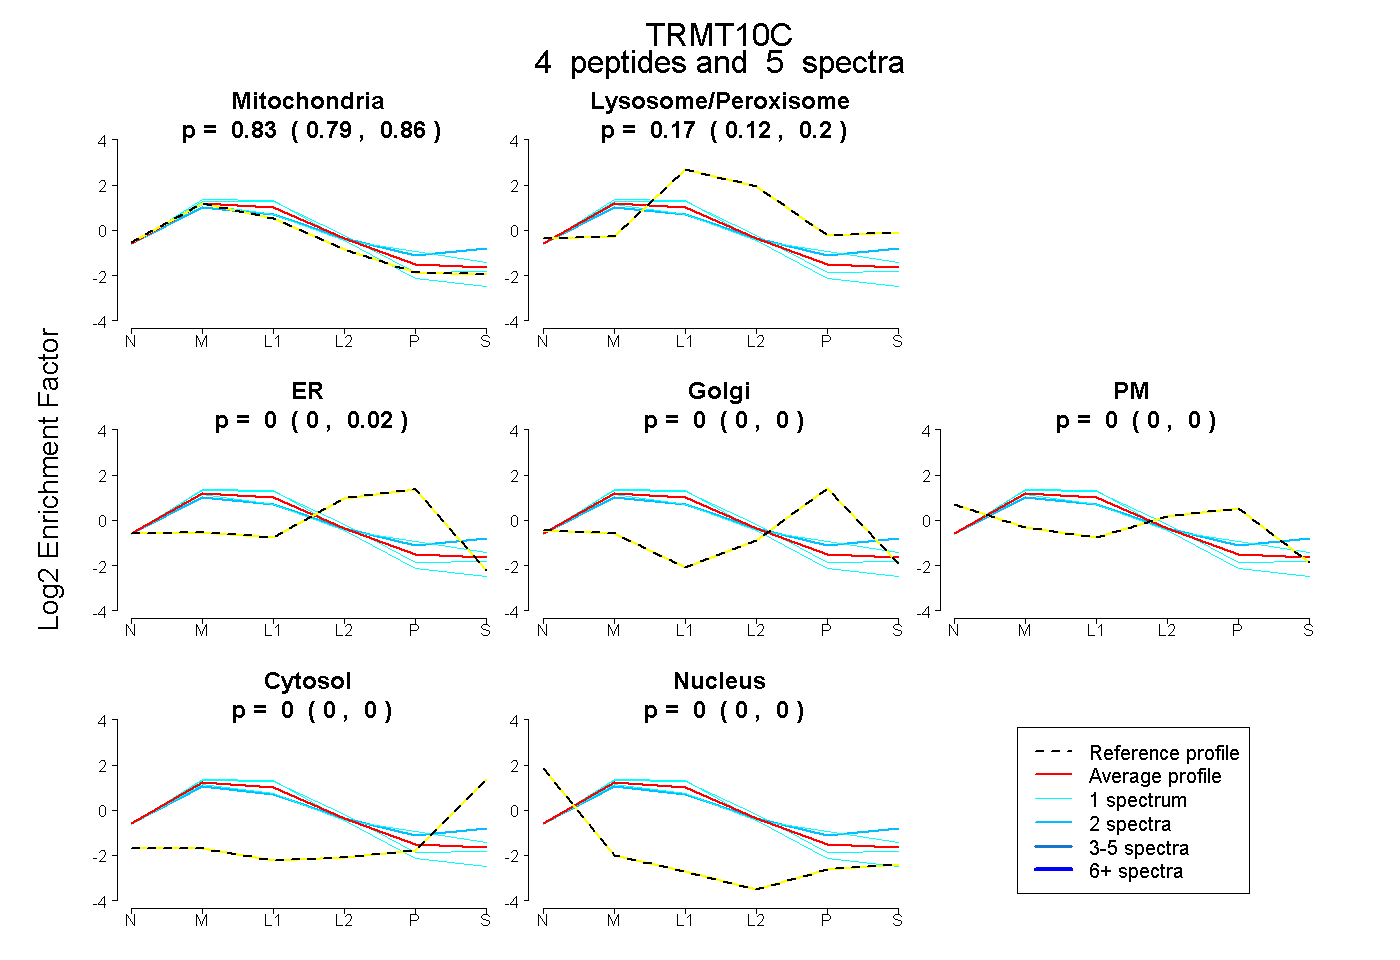 |
0.834 0.792 | 0.865 |
0.166 0.124 | 0.197 |
0.000 0.000 | 0.025 |
0.000 0.000 | 0.000 |
0.000 0.000 | 0.000 |
0.000 0.000 | 0.001 |
0.000 0.000 | 0.000 |
|||
| Plot | Lyso | Other | |||||||||||
| Expt C |
17 peptides |
61 spectra |
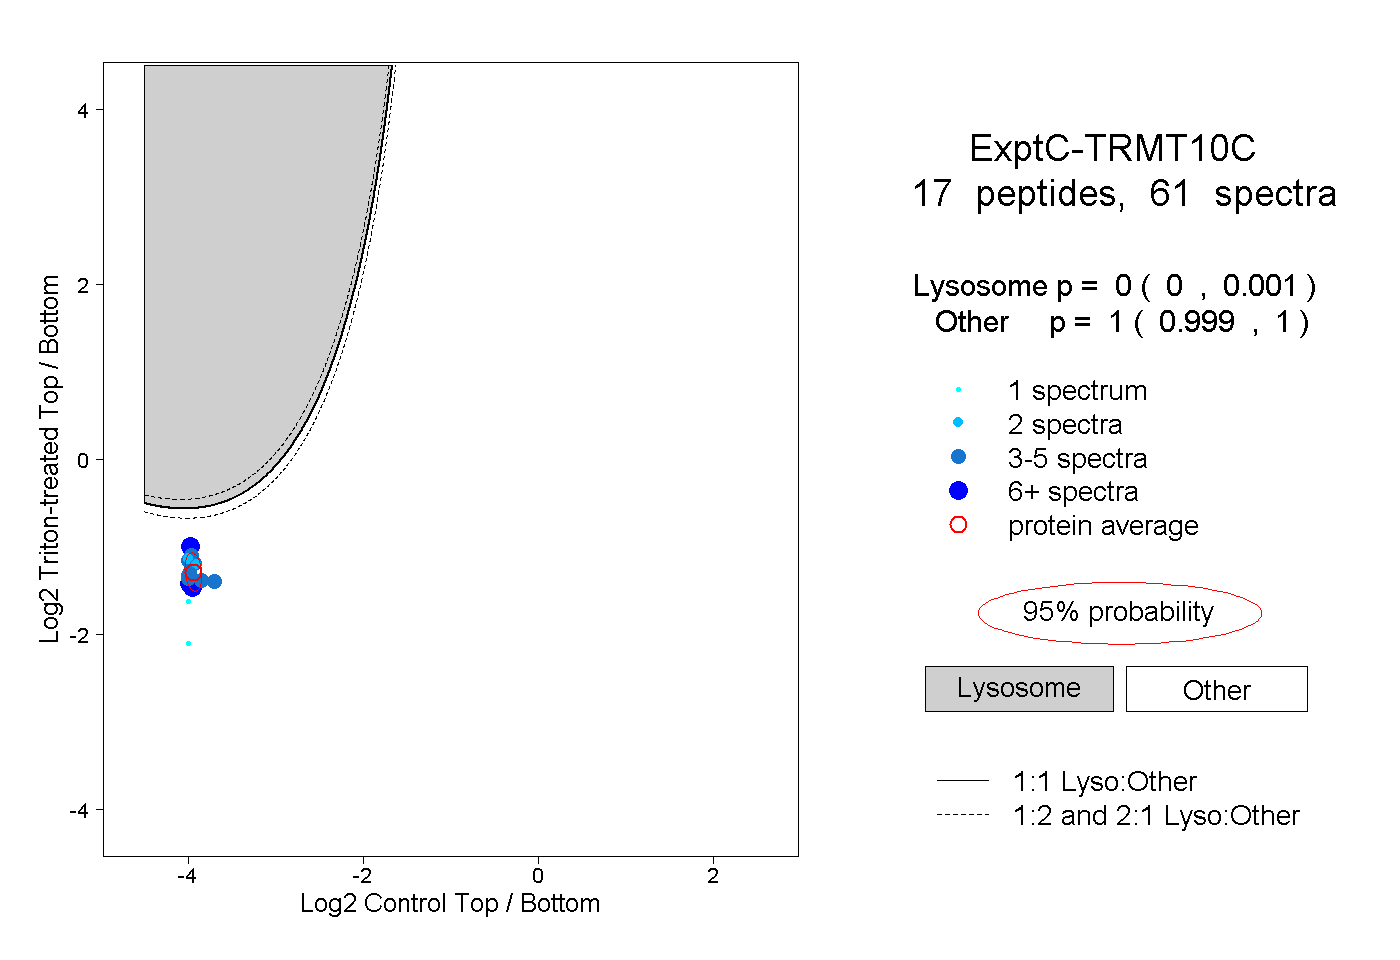 |
0.000 0.000 | 0.001 |
1.000 0.999 | 1.000 |
||||||||
| Plot | Lyso | Other | |||||||||||
| Expt D |
2 peptides |
2 spectra |
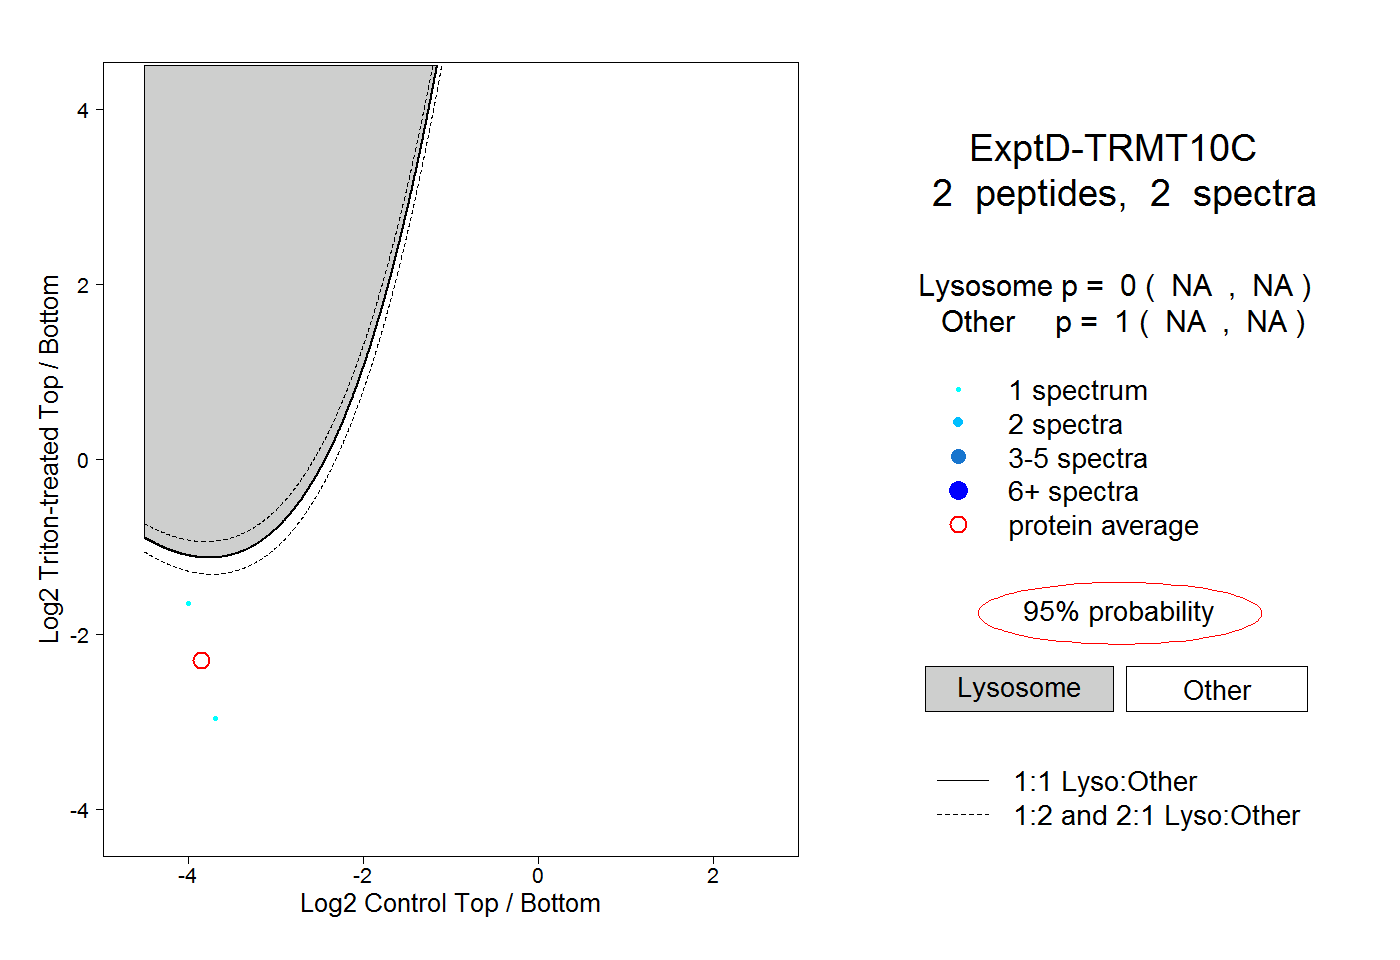 |
0.000 NA | NA |
1.000 NA | NA |