10
10peptides
spectra
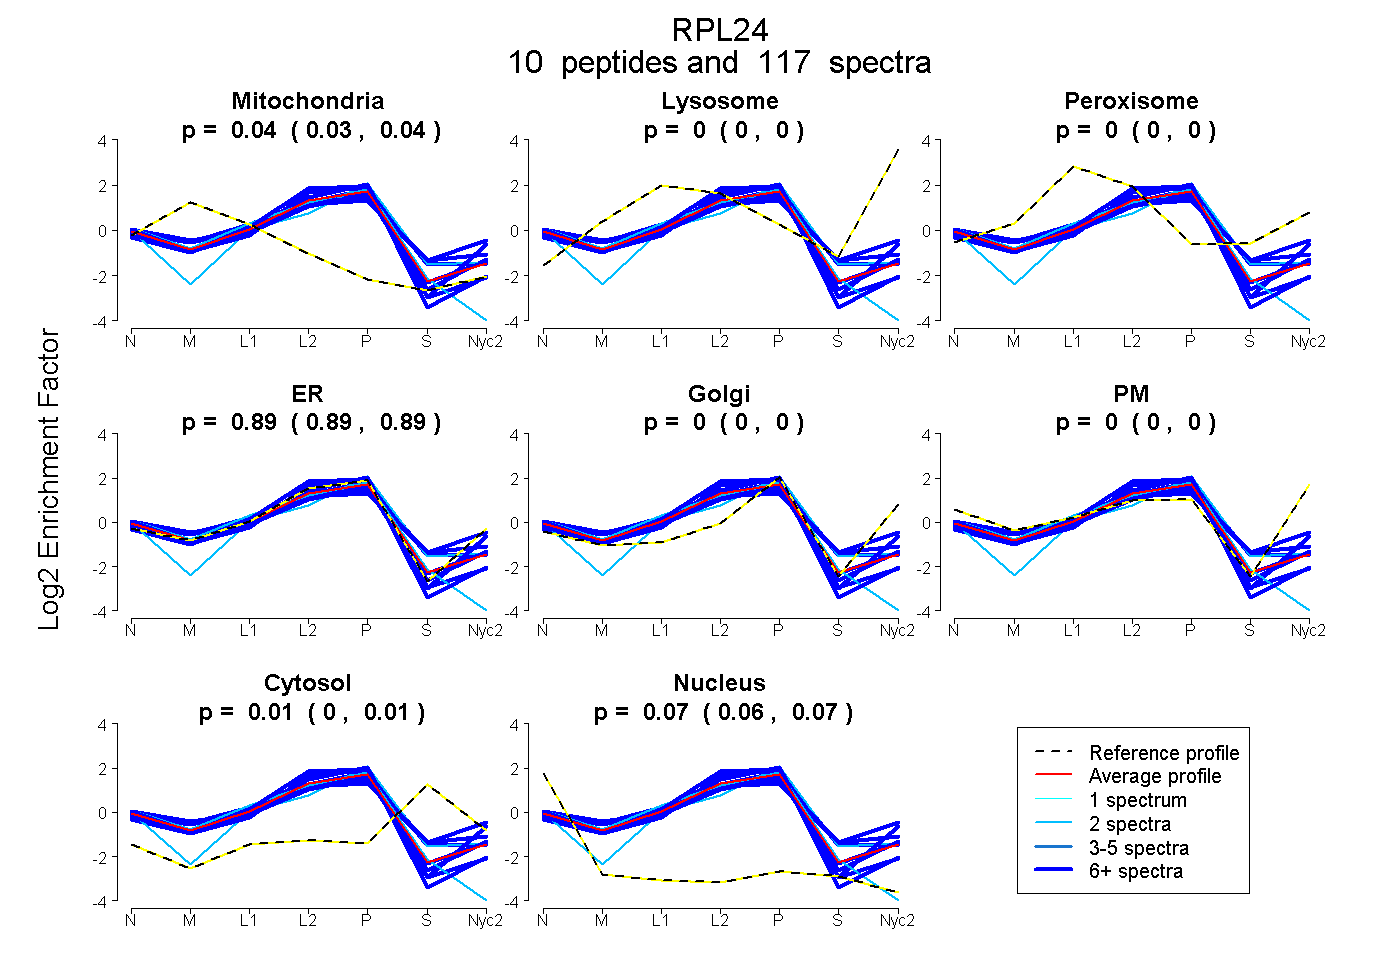
0.031 | 0.040
0.000 | 0.000
0.000 | 0.000
0.886 | 0.895
0.000 | 0.000
0.000 | 0.000
0.000 | 0.012
0.062 | 0.071
9peptides
spectra
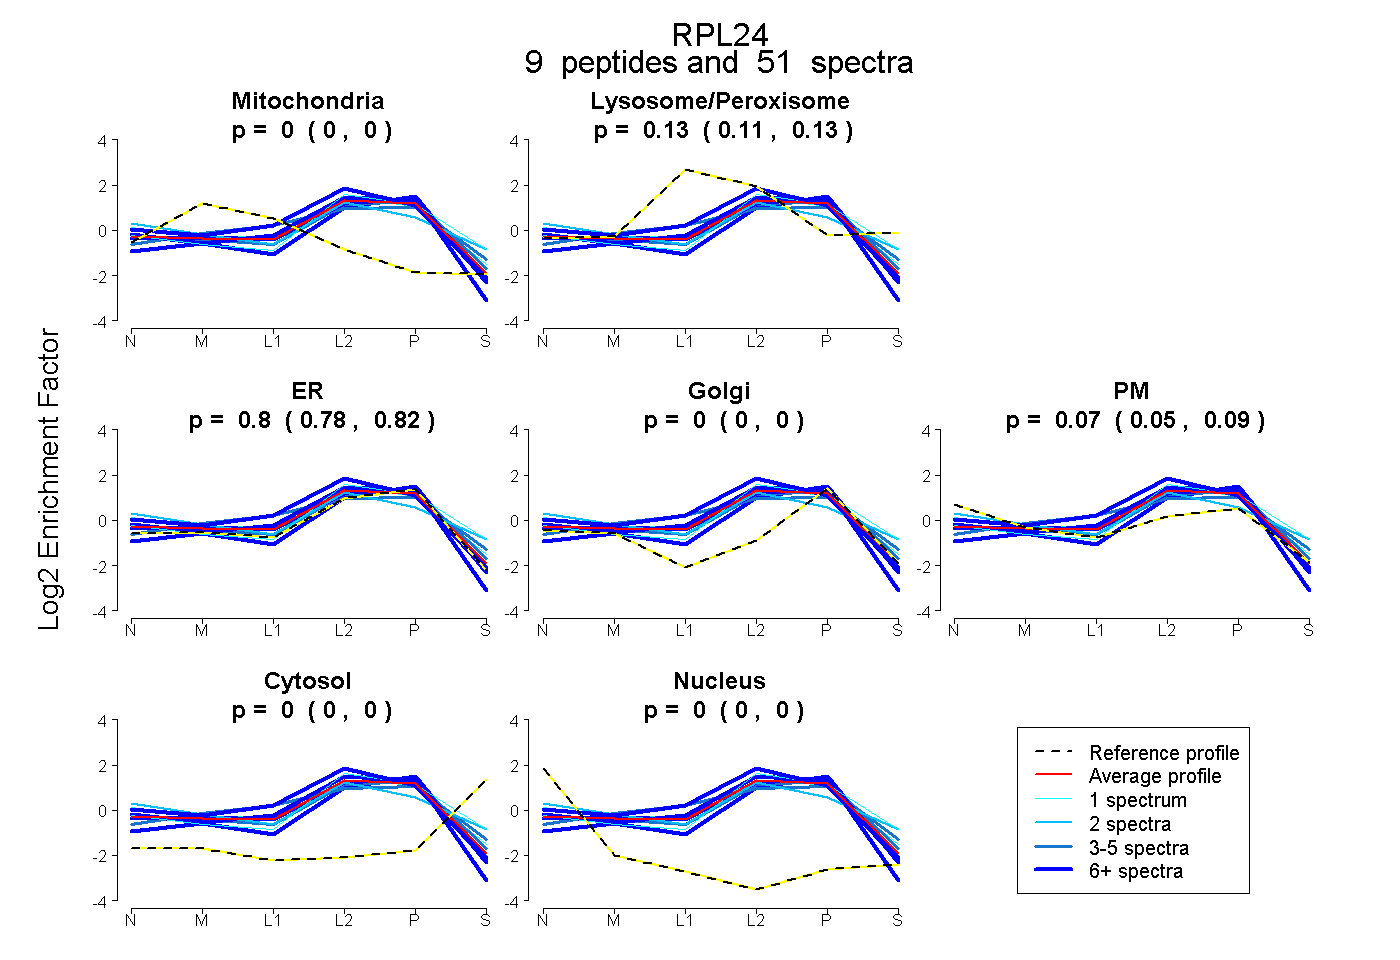
0.000 | 0.000
0.114 | 0.134
0.784 | 0.822
0.000 | 0.000
0.052 | 0.086
0.000 | 0.000
0.000 | 0.000