 10
10peptides
spectra
0.031 | 0.040
0.000 | 0.000
0.000 | 0.000
0.886 | 0.895
0.000 | 0.000
0.000 | 0.000
0.000 | 0.012
0.062 | 0.071
| Plot | Mito | Lyso | Perox | ER | Golgi | PM | Cytosol | Nucleus | |||||
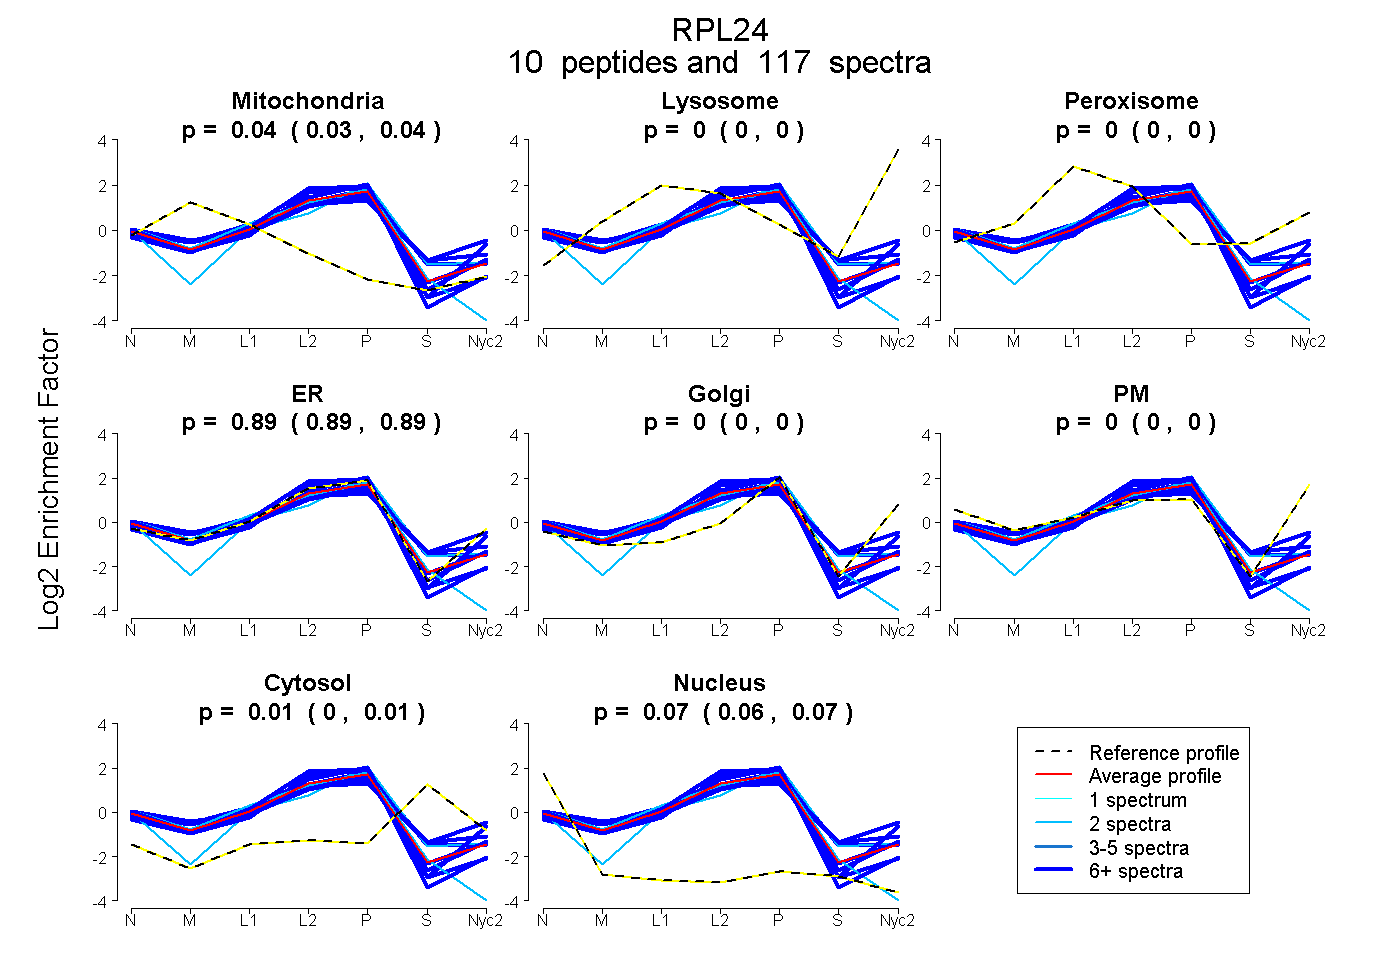
| Expt A |
10 peptides |
117 spectra |
|
0.036 0.031 | 0.040 |
0.000 0.000 | 0.000 |
0.000 0.000 | 0.000 |
0.891 0.886 | 0.895 |
0.000 0.000 | 0.000 |
0.000 0.000 | 0.000 |
0.005 0.000 | 0.012 |
0.067 0.062 | 0.071 |
| 9 spectra, GQSEEIQK | 0.115 | 0.000 | 0.000 | 0.857 | 0.000 | 0.000 | 0.000 | 0.027 | ||
| 31 spectra, IYPGHGR | 0.000 | 0.000 | 0.147 | 0.723 | 0.000 | 0.000 | 0.130 | 0.000 | ||
| 14 spectra, QINWTVLYR | 0.000 | 0.000 | 0.000 | 0.980 | 0.000 | 0.000 | 0.000 | 0.020 | ||
| 10 spectra, AITGASLADIMAK | 0.000 | 0.000 | 0.000 | 0.831 | 0.000 | 0.000 | 0.162 | 0.006 | ||
| 15 spectra, VFQFLNAK | 0.000 | 0.000 | 0.000 | 0.928 | 0.000 | 0.000 | 0.000 | 0.072 | ||
| 2 spectra, VELCSFSGYK | 0.099 | 0.000 | 0.000 | 0.745 | 0.000 | 0.000 | 0.000 | 0.156 | ||
| 2 spectra, IVKPVK | 0.000 | 0.000 | 0.000 | 0.766 | 0.000 | 0.000 | 0.175 | 0.059 | ||
| 6 spectra, CESAFLSK | 0.068 | 0.000 | 0.056 | 0.720 | 0.000 | 0.000 | 0.156 | 0.000 | ||
| 11 spectra, NQKPEVR | 0.000 | 0.000 | 0.000 | 0.898 | 0.000 | 0.000 | 0.000 | 0.102 | ||
| 17 spectra, TAMAAAK | 0.112 | 0.000 | 0.000 | 0.829 | 0.000 | 0.000 | 0.000 | 0.059 |
| Plot | Mito | Lyso or Perox | ER | Golgi | PM | Cytosol | Nucleus | ||||||
| Expt B |
9 peptides |
51 spectra |
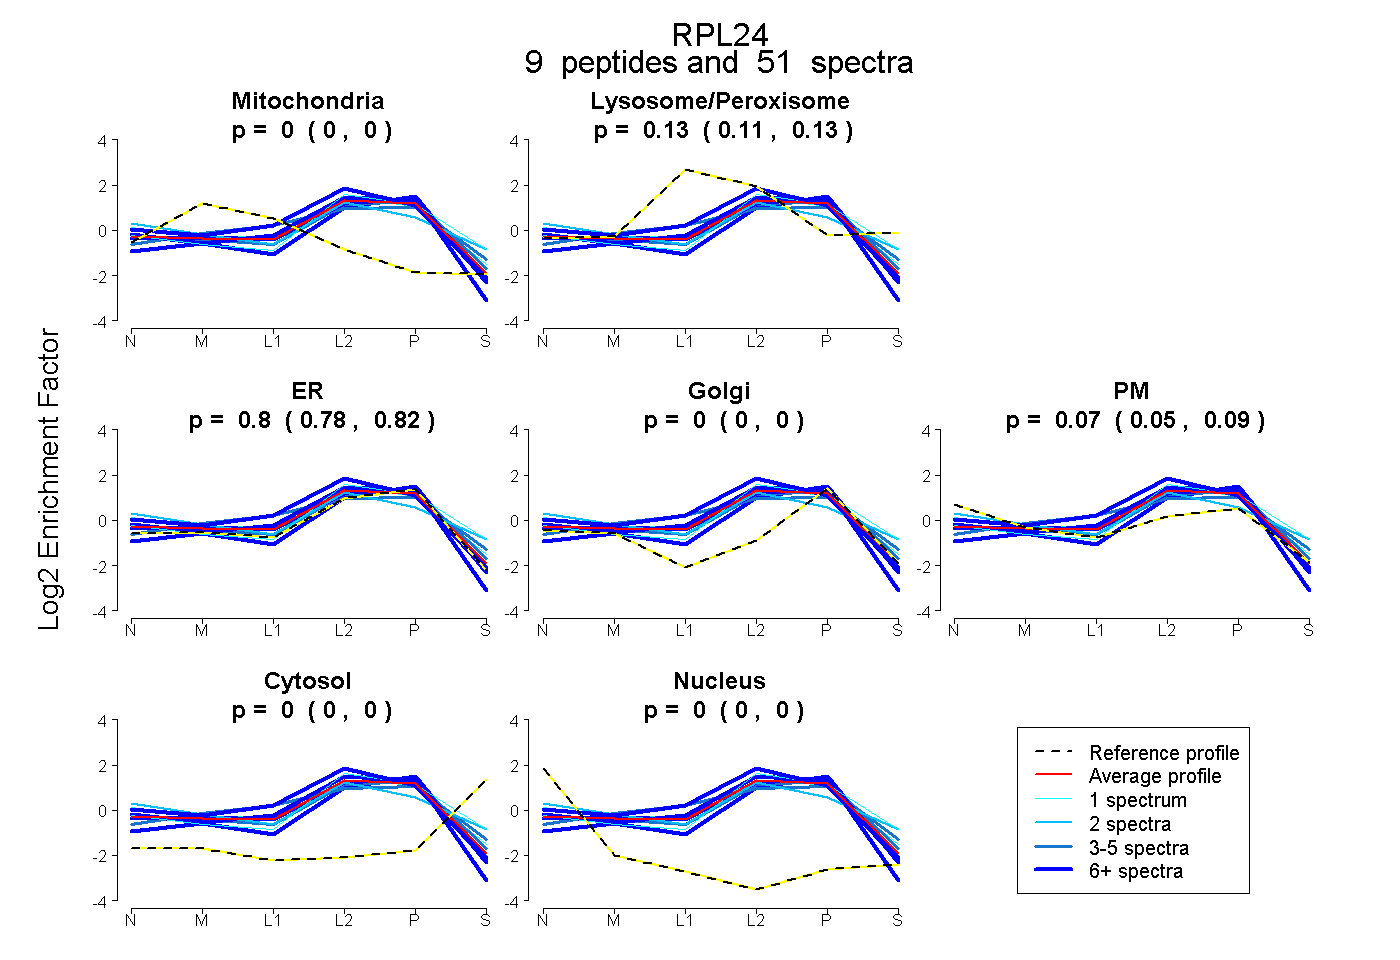 |
0.000 0.000 | 0.000 |
0.125 0.114 | 0.134 |
0.805 0.784 | 0.822 |
0.000 0.000 | 0.000 |
0.070 0.052 | 0.086 |
0.000 0.000 | 0.000 |
0.000 0.000 | 0.000 |
|||
| Plot | Lyso | Other | |||||||||||
| Expt C |
9 peptides |
141 spectra |
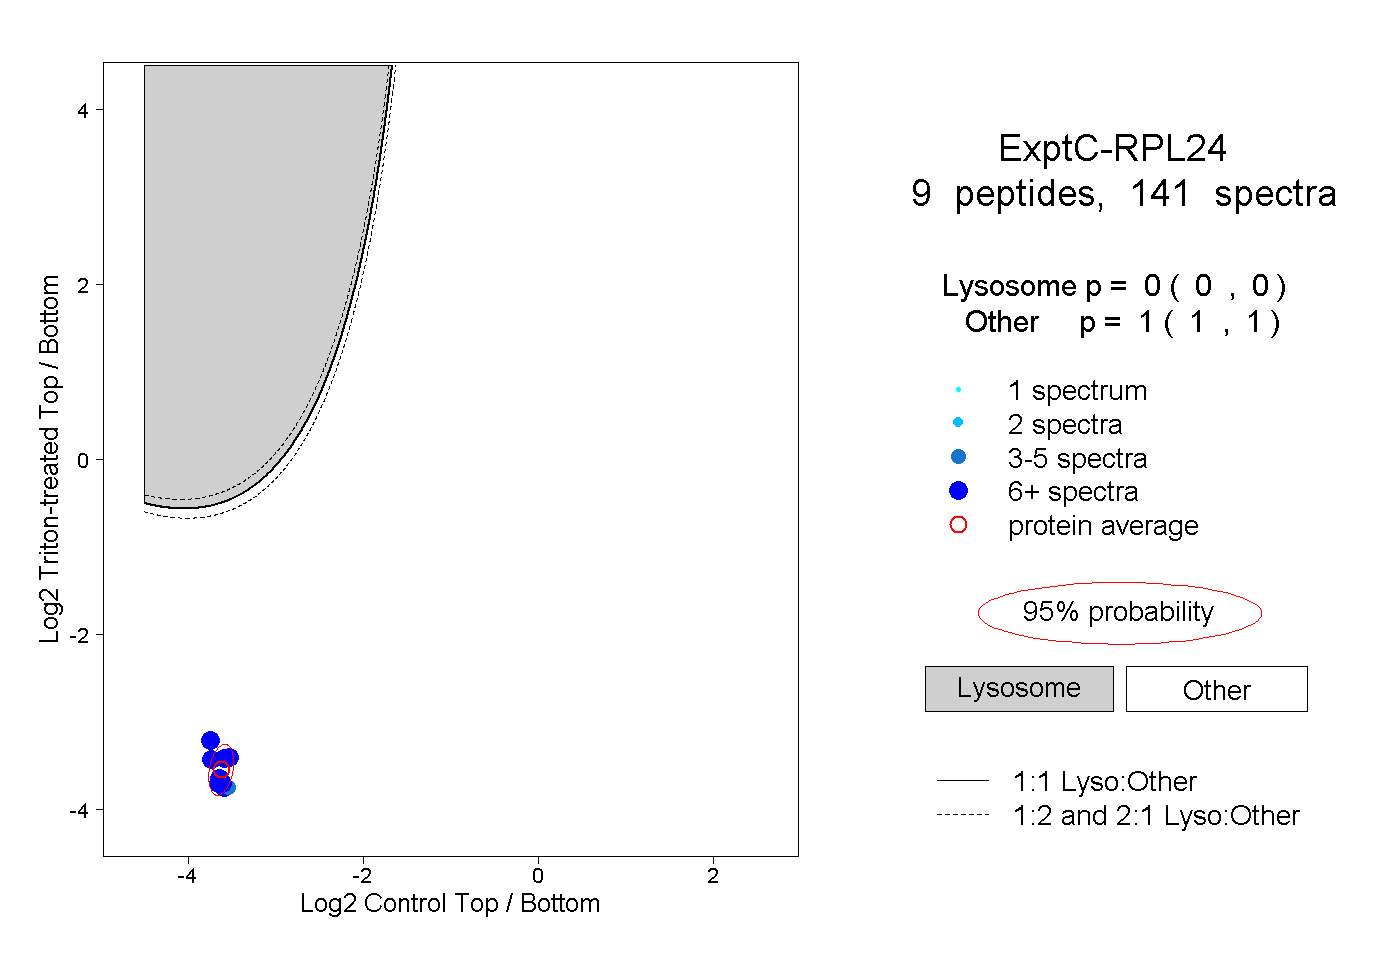 |
0.000 0.000 | 0.000 |
1.000 1.000 | 1.000 |
||||||||
| Plot | Lyso | Other | |||||||||||
| Expt D |
4 peptides |
14 spectra |
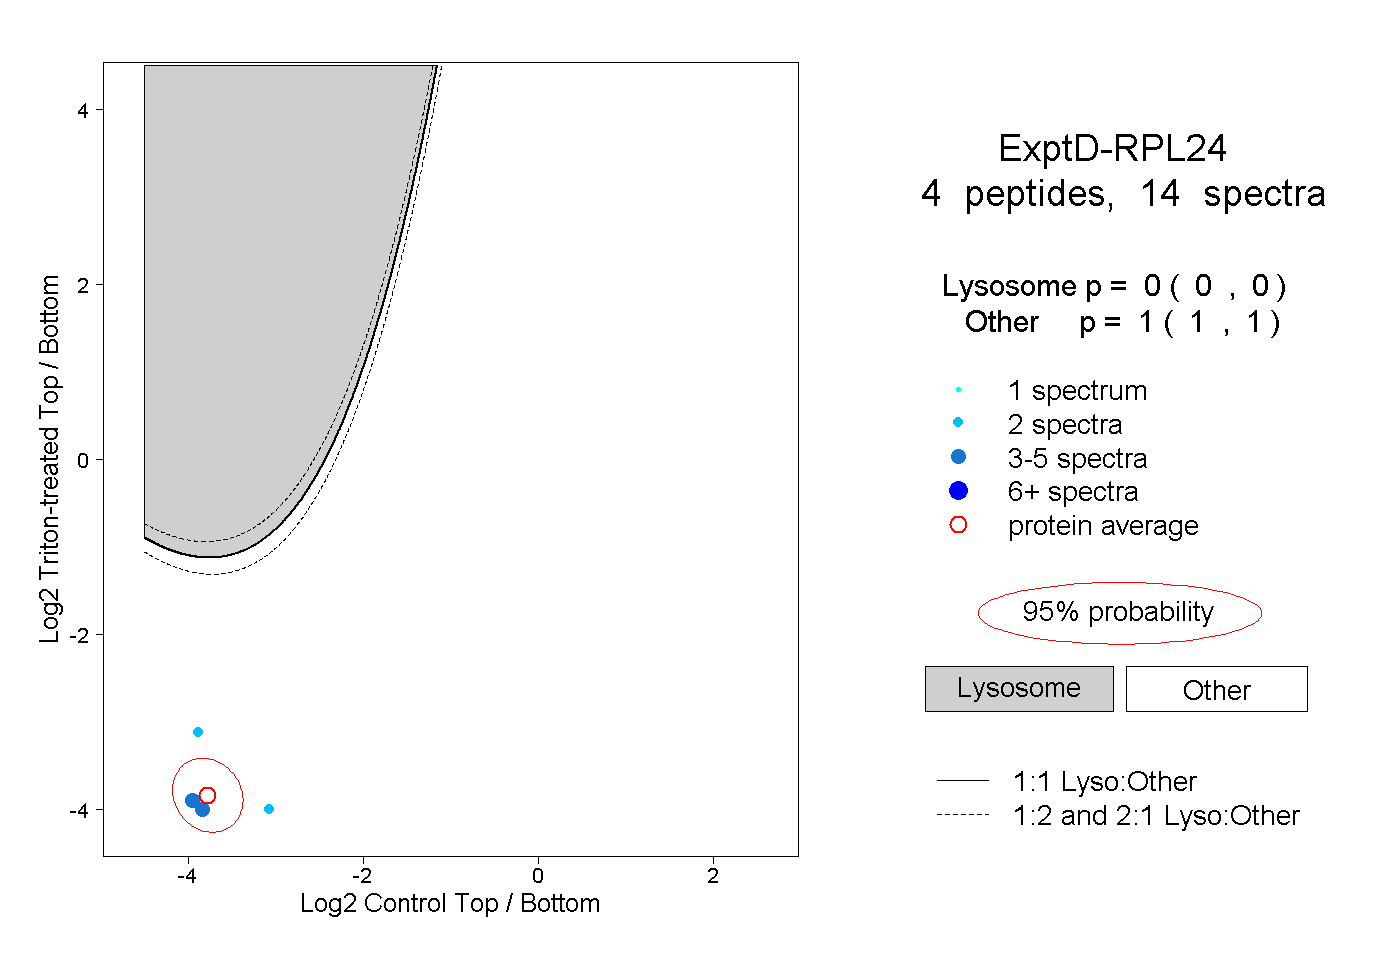 |
0.000 0.000 | 0.000 |
1.000 1.000 | 1.000 |