 1
1peptide
spectra
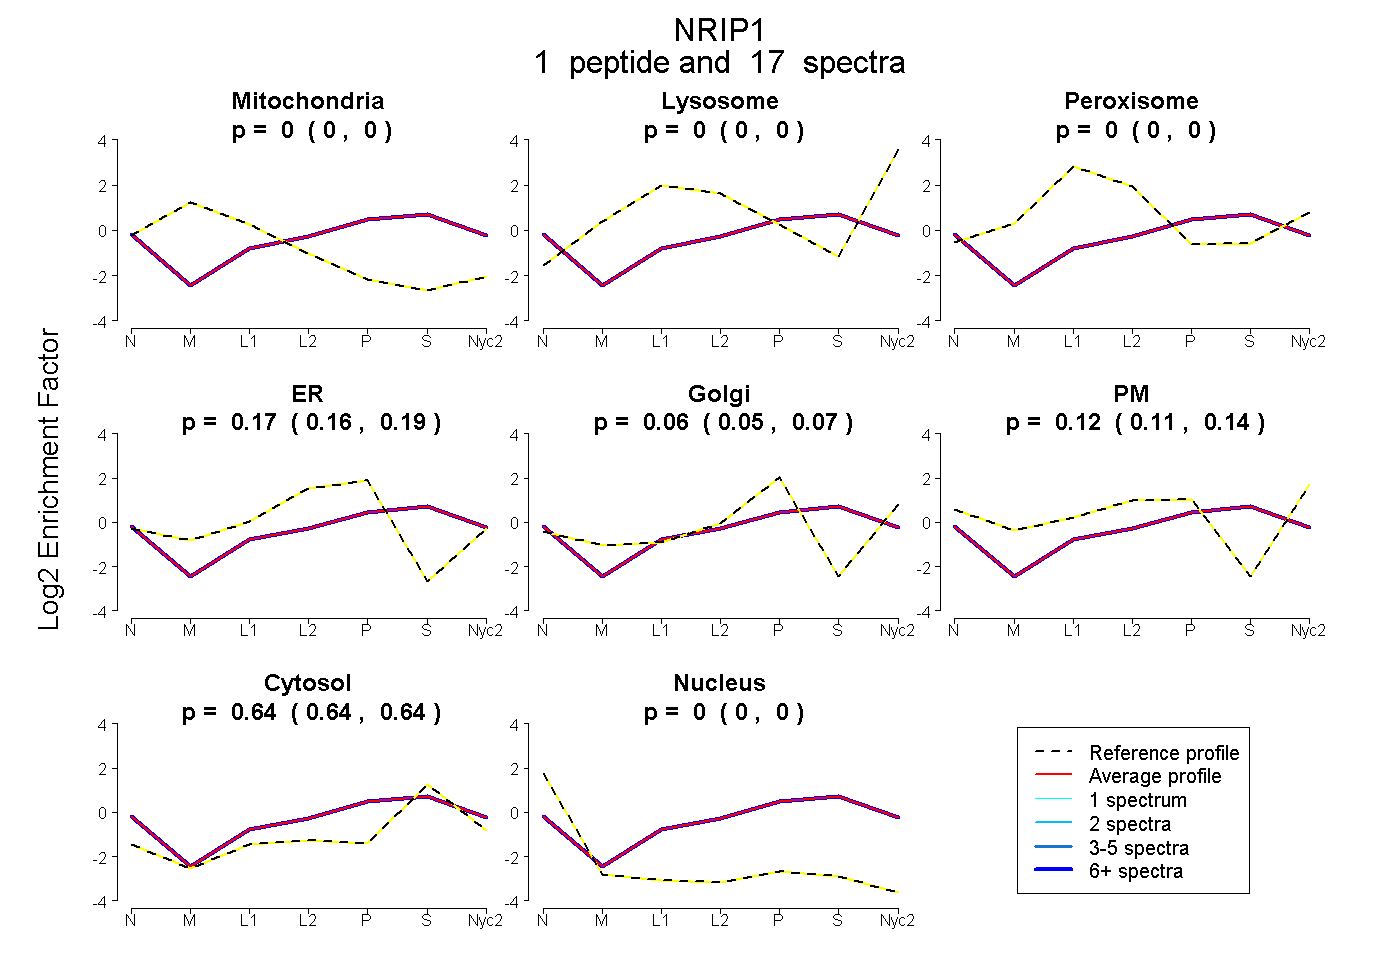
0.000 | 0.000
0.000 | 0.000
0.000 | 0.000
0.158 | 0.187
0.050 | 0.070
0.111 | 0.135
0.638 | 0.644
0.000 | 0.000
2peptides
spectra
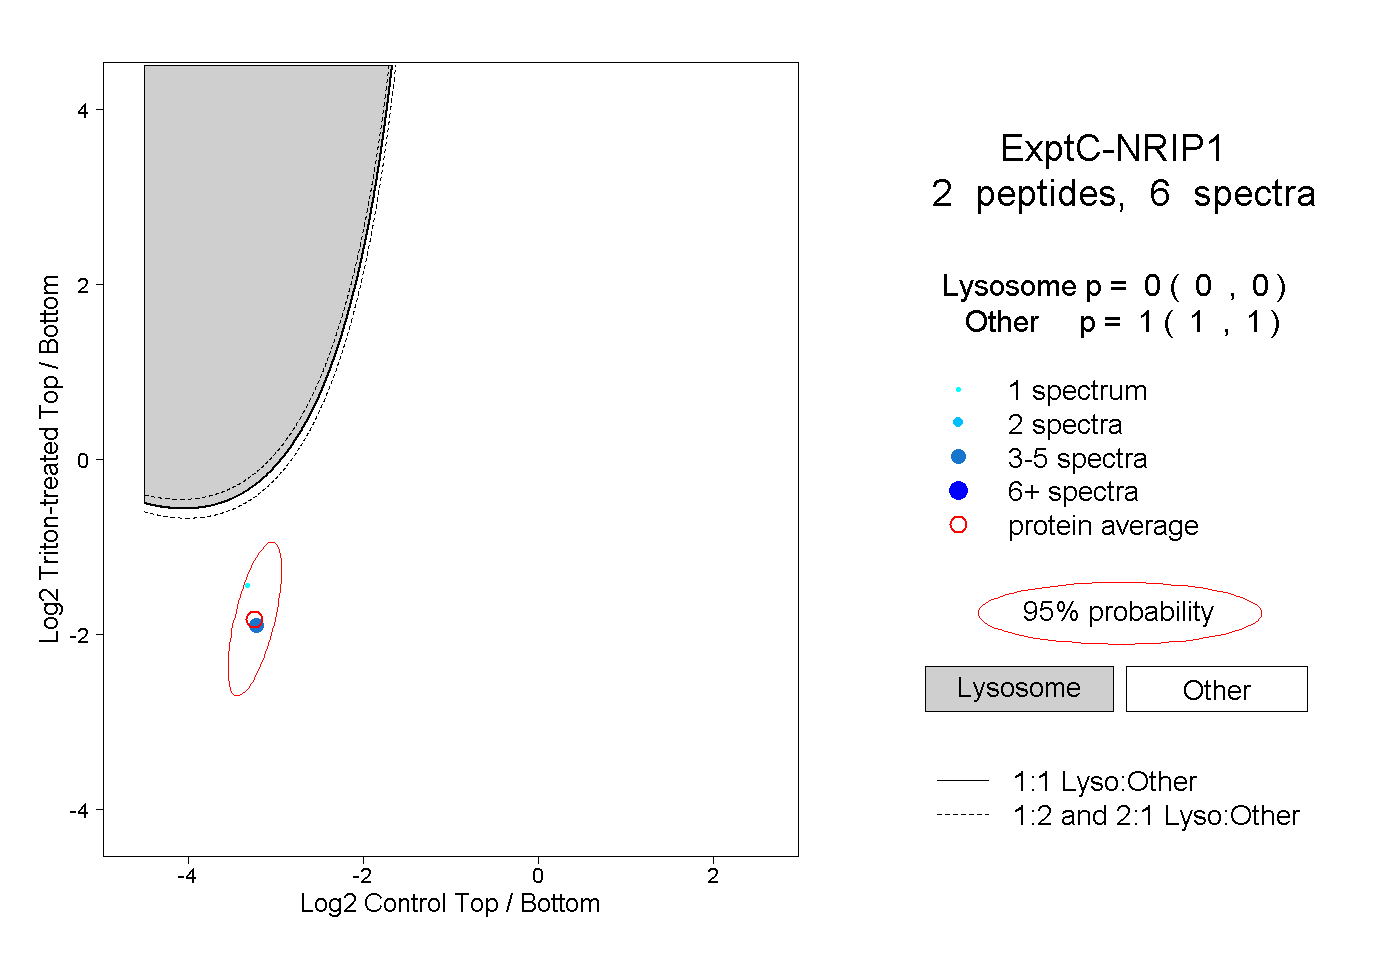
0.000 | 0.000
1.000 | 1.000
1peptide
spectra
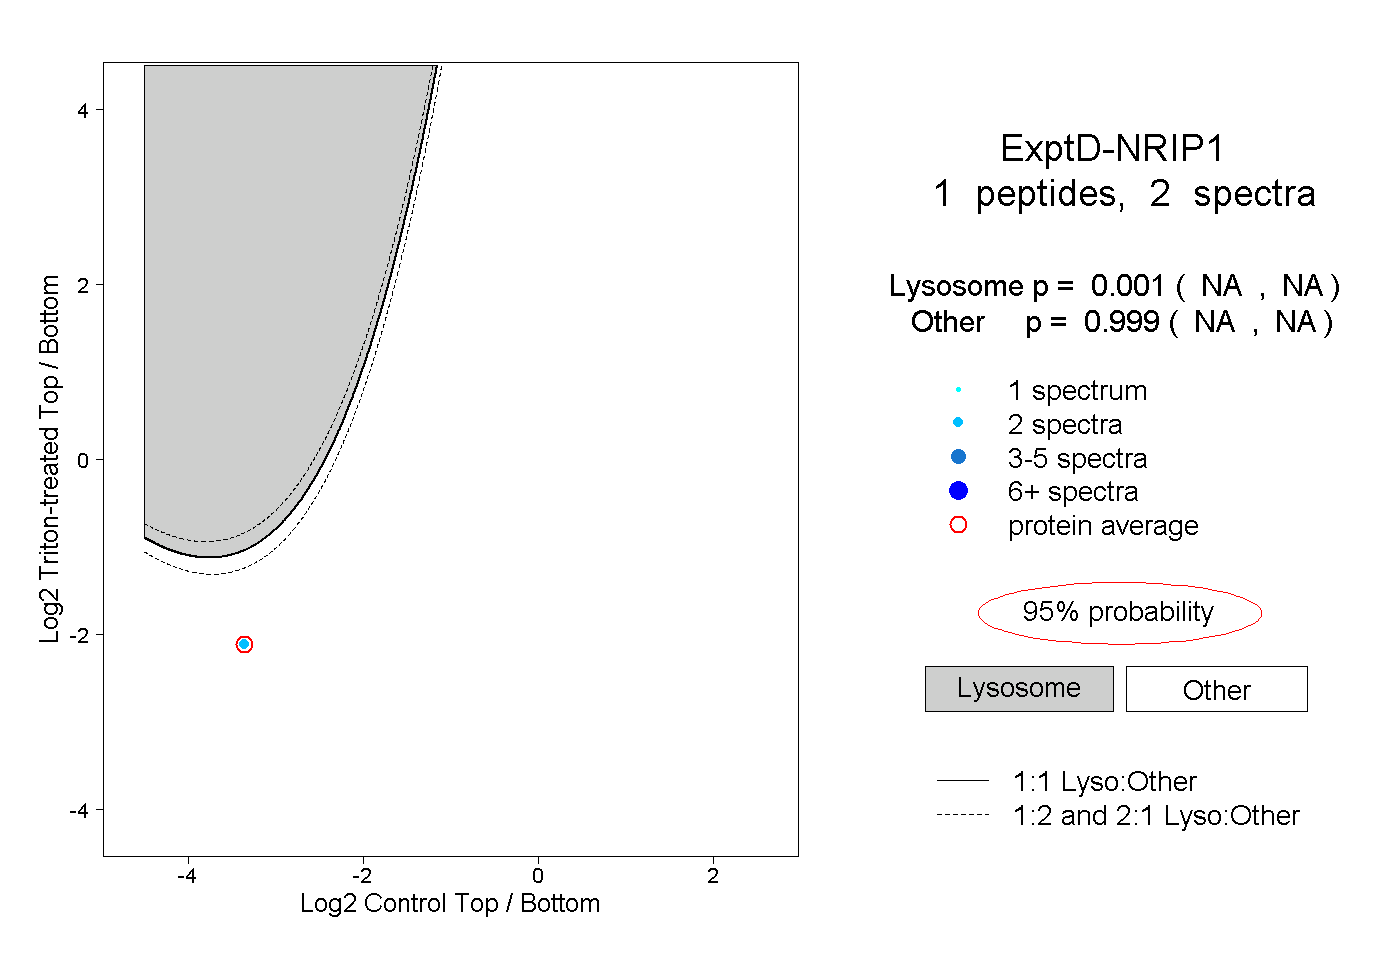
NA | NA
NA | NA