 3
3peptides
spectra
0.000 | 0.000
0.132 | 0.276
0.404 | 0.605
0.191 | 0.327
0.000 | 0.000
0.000 | 0.053
0.000 | 0.000
0.000 | 0.000
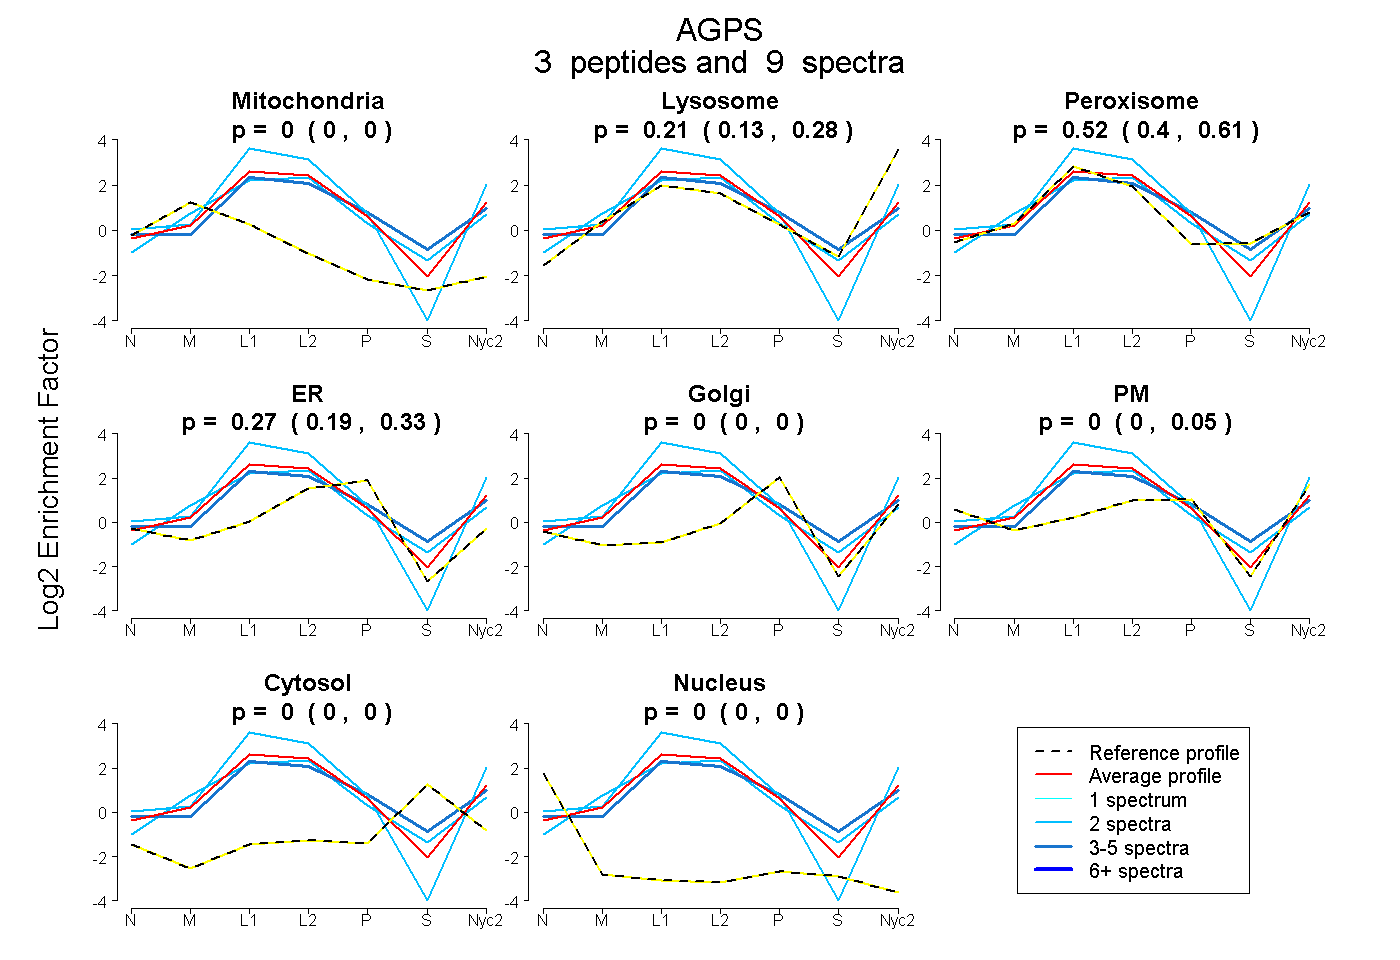
| Plot | Mito | Lyso | Perox | ER | Golgi | PM | Cytosol | Nucleus | |||||
| Expt A |
3 peptides |
9 spectra |
|
0.000 0.000 | 0.000 |
0.212 0.132 | 0.276 |
0.516 0.404 | 0.605 |
0.272 0.191 | 0.327 |
0.000 0.000 | 0.000 |
0.000 0.000 | 0.053 |
0.000 0.000 | 0.000 |
0.000 0.000 | 0.000 |
| 5 spectra, TIISLDTSQMNR | 0.000 | 0.110 | 0.622 | 0.268 | 0.000 | 0.000 | 0.000 | 0.000 | ||
| 2 spectra, YPLSGLALPTLK | 0.000 | 0.334 | 0.346 | 0.174 | 0.000 | 0.146 | 0.000 | 0.000 | ||
| 2 spectra, IRPTPEYQK | 0.000 | 0.122 | 0.656 | 0.221 | 0.000 | 0.000 | 0.000 | 0.000 |
| Plot | Mito | Lyso or Perox | ER | Golgi | PM | Cytosol | Nucleus | ||||||
| Expt B |
1 peptide |
1 spectrum |
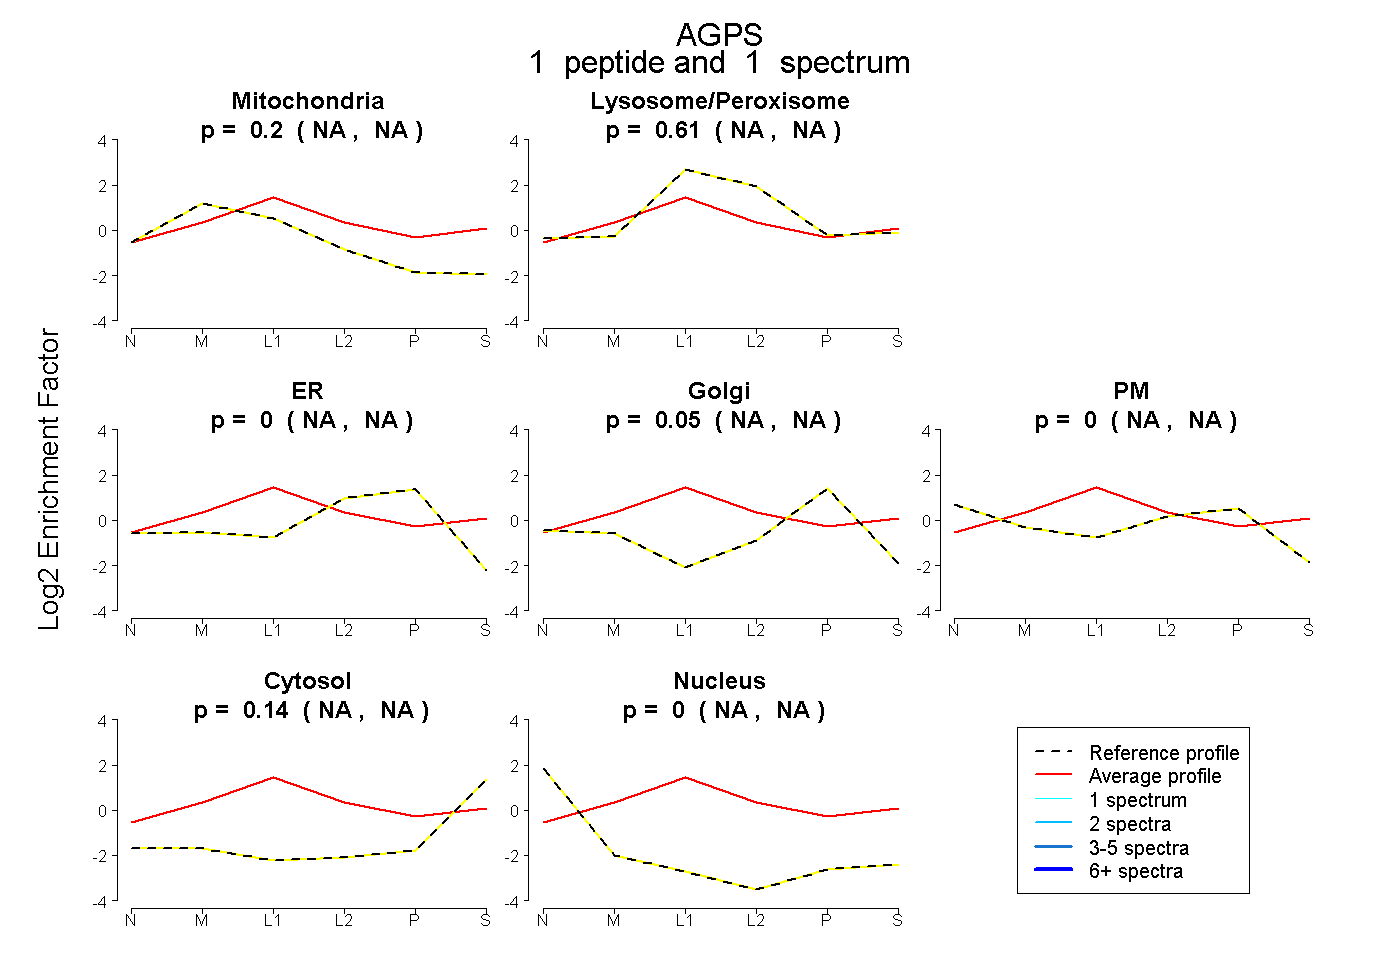 |
0.203 NA | NA |
0.609 NA | NA |
0.000 NA | NA |
0.050 NA | NA |
0.000 NA | NA |
0.138 NA | NA |
0.000 NA | NA |
|||
| Plot | Lyso | Other | |||||||||||
| Expt C |
8 peptides |
34 spectra |
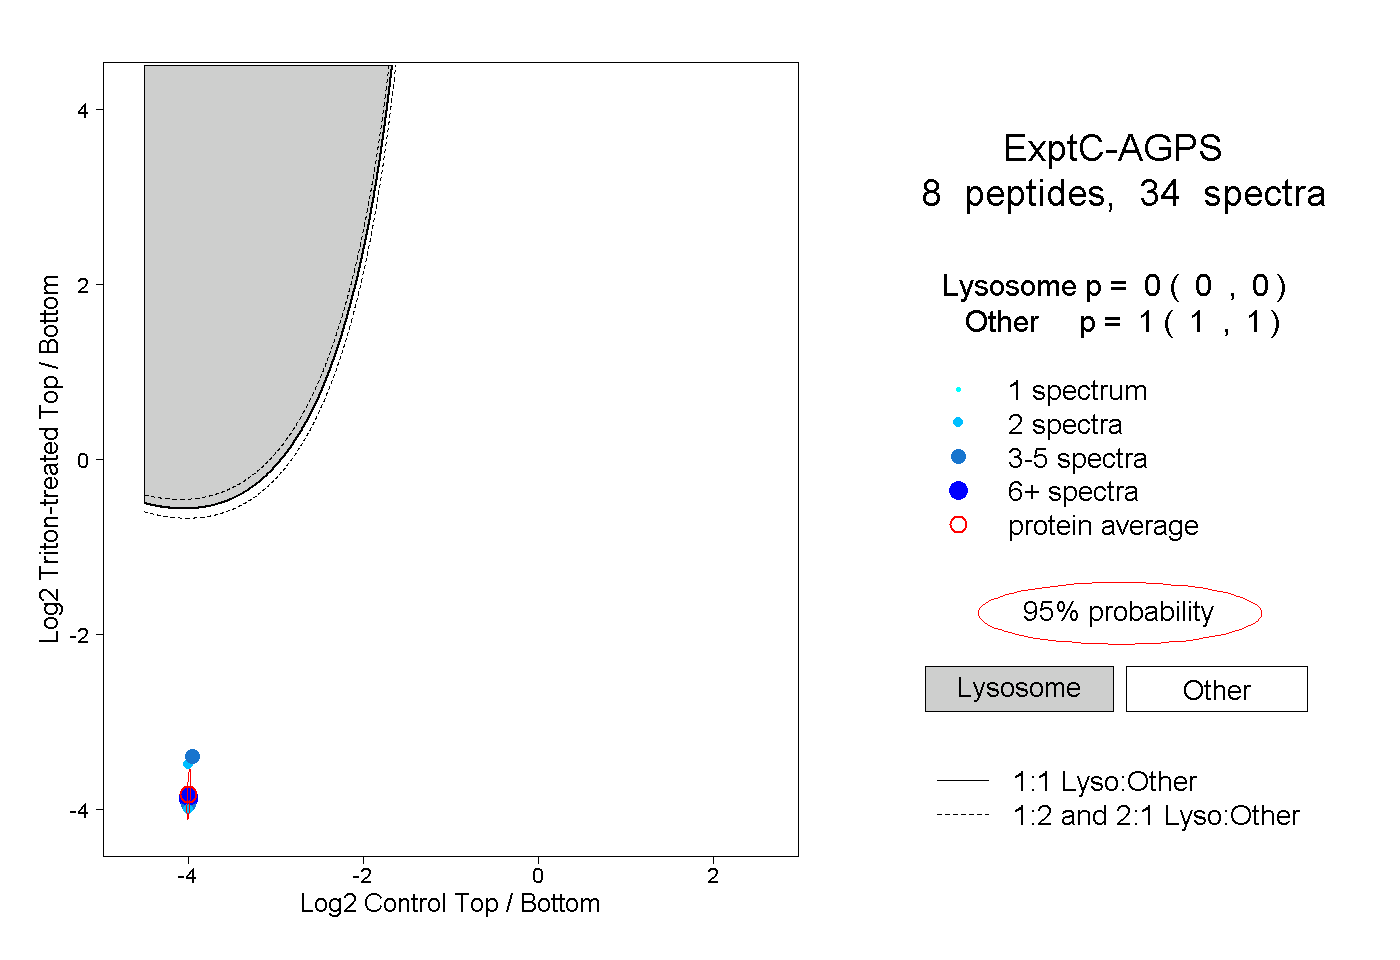 |
0.000 0.000 | 0.000 |
1.000 1.000 | 1.000 |
||||||||
| Plot | Lyso | Other | |||||||||||
| Expt D |
3 peptides |
5 spectra |
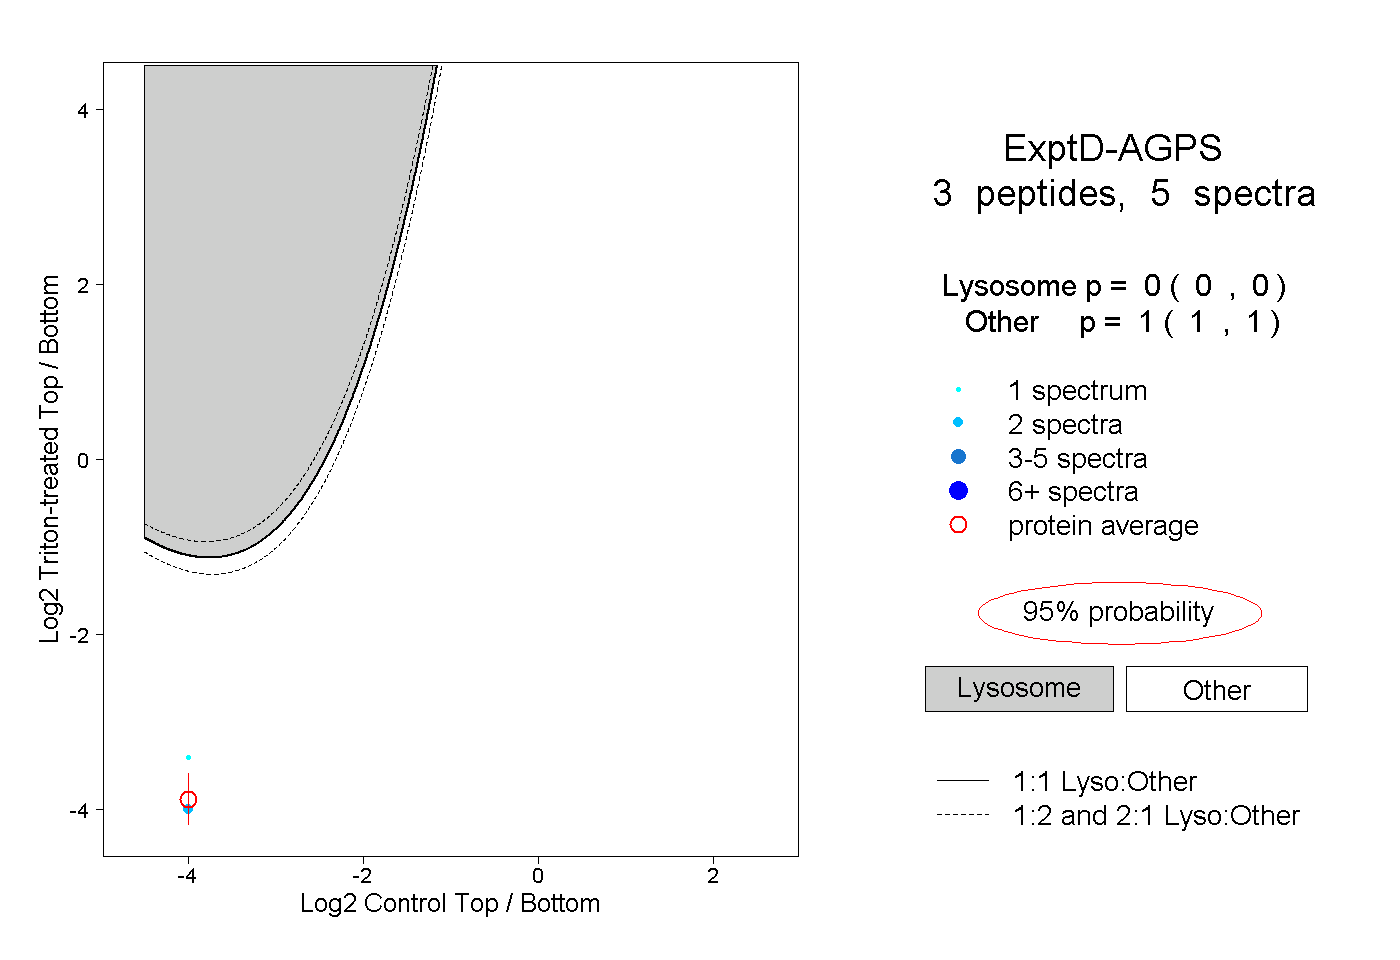 |
0.000 0.000 | 0.000 |
1.000 1.000 | 1.000 |