 18
18peptides
spectra
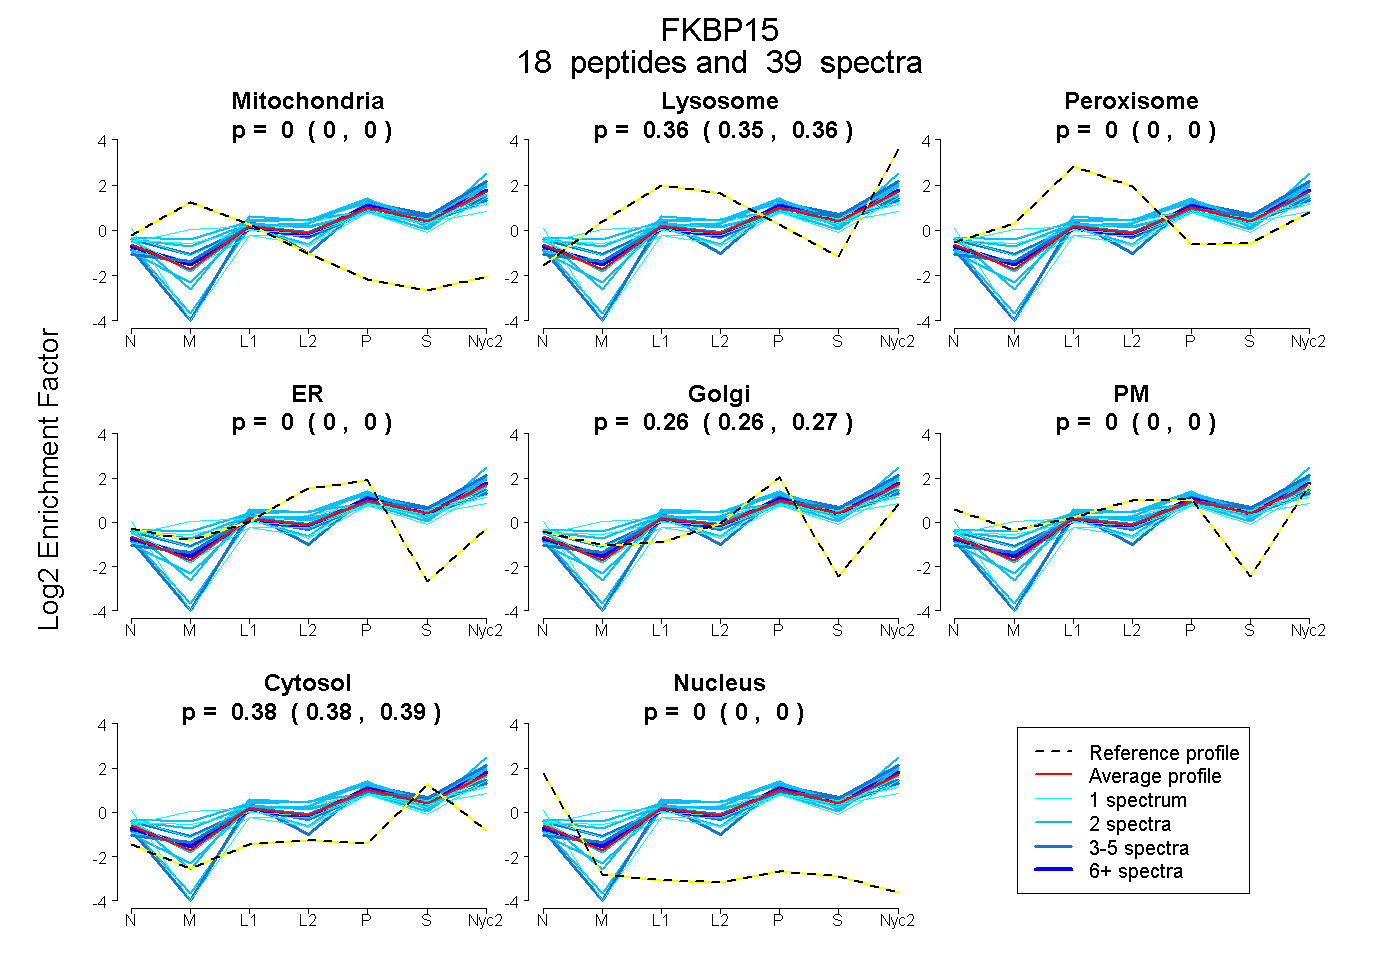
0.000 | 0.000
0.349 | 0.361
0.000 | 0.000
0.000 | 0.000
0.258 | 0.266
0.000 | 0.000
0.378 | 0.387
0.000 | 0.000
7peptides
spectra
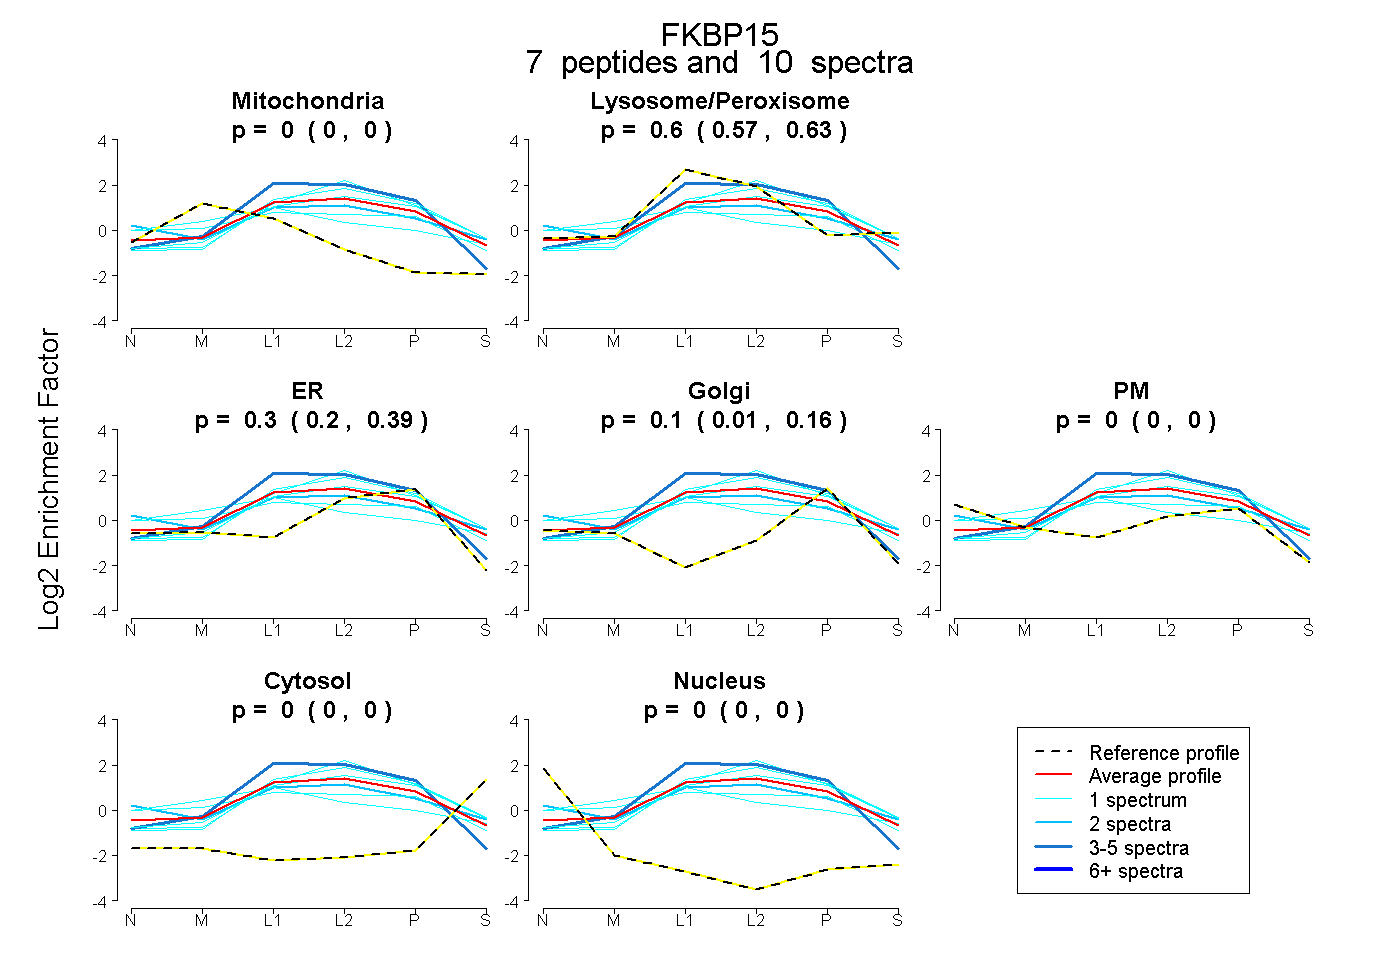
0.000 | 0.000
0.568 | 0.629
0.202 | 0.393
0.014 | 0.160
0.000 | 0.000
0.000 | 0.000
0.000 | 0.000
24peptides
spectra
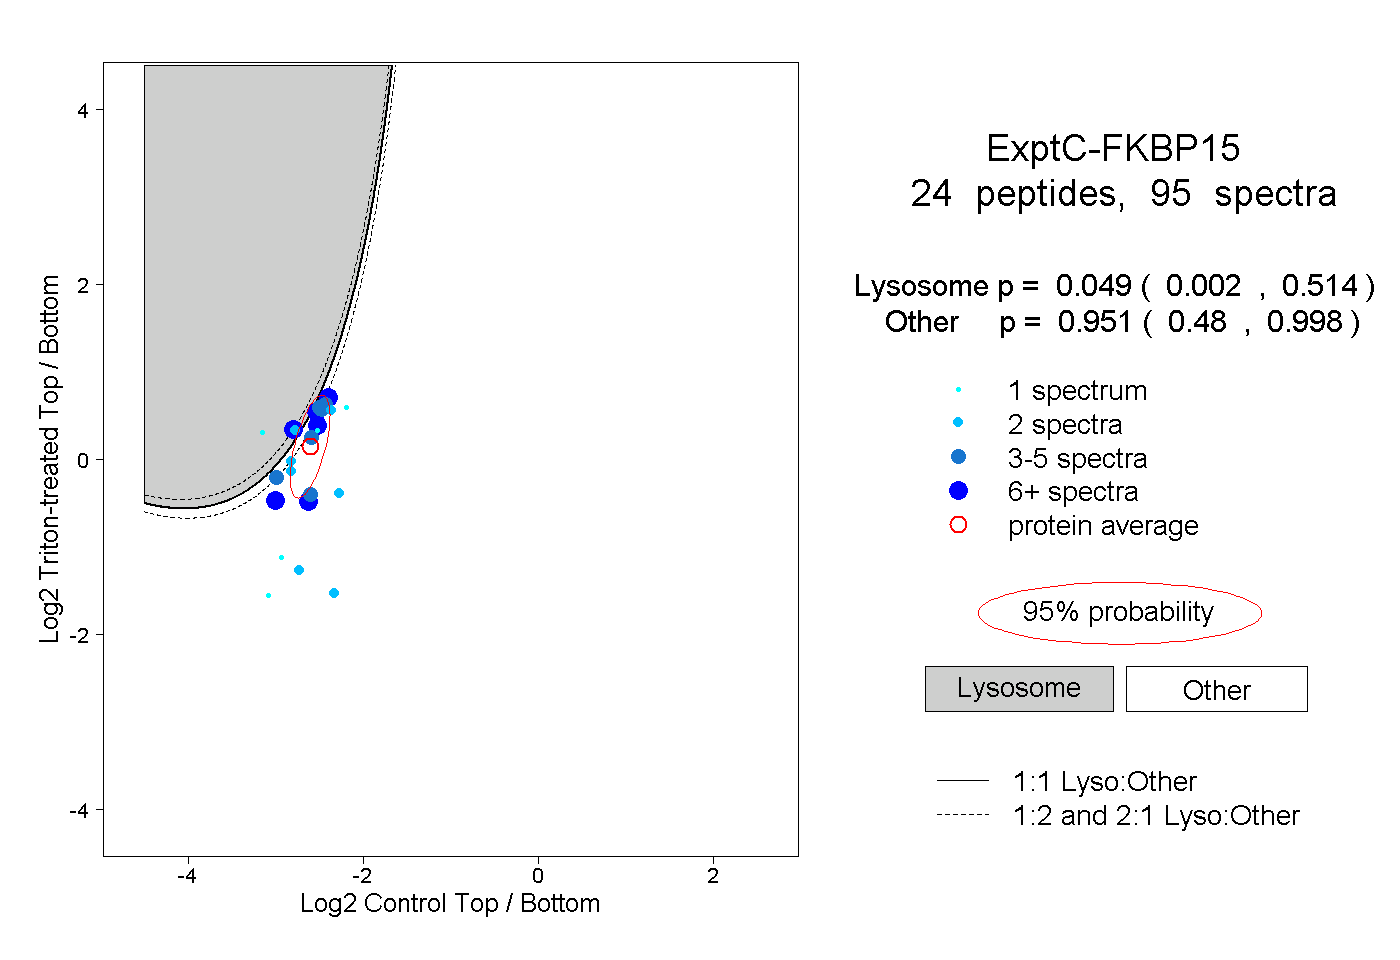
0.002 | 0.514
0.480 | 0.998
7peptides
spectra
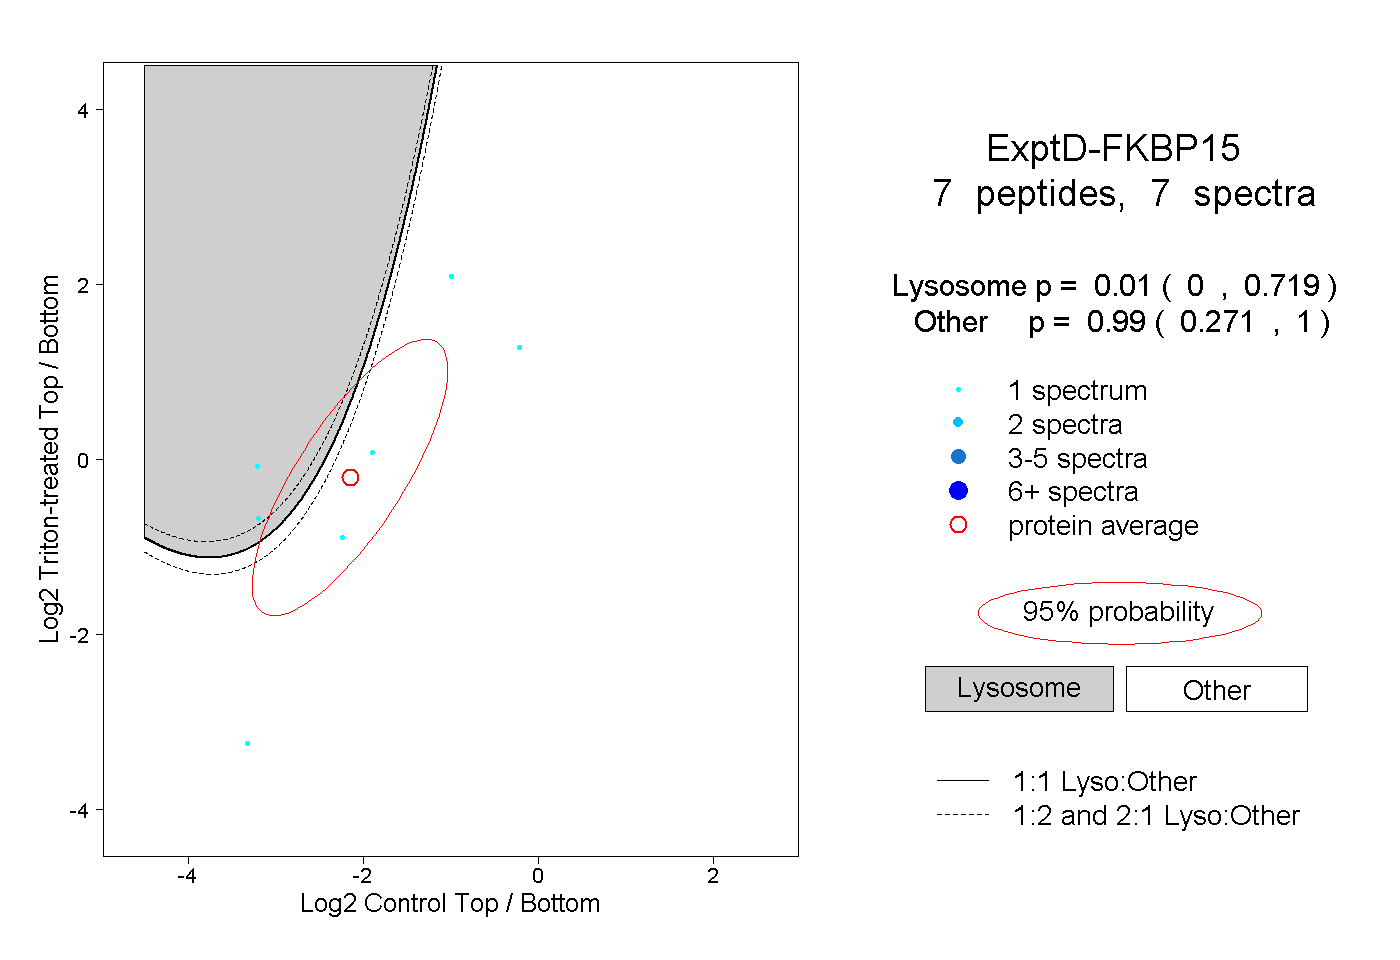
0.000 | 0.719
0.271 | 1.000