4
4peptides
spectra
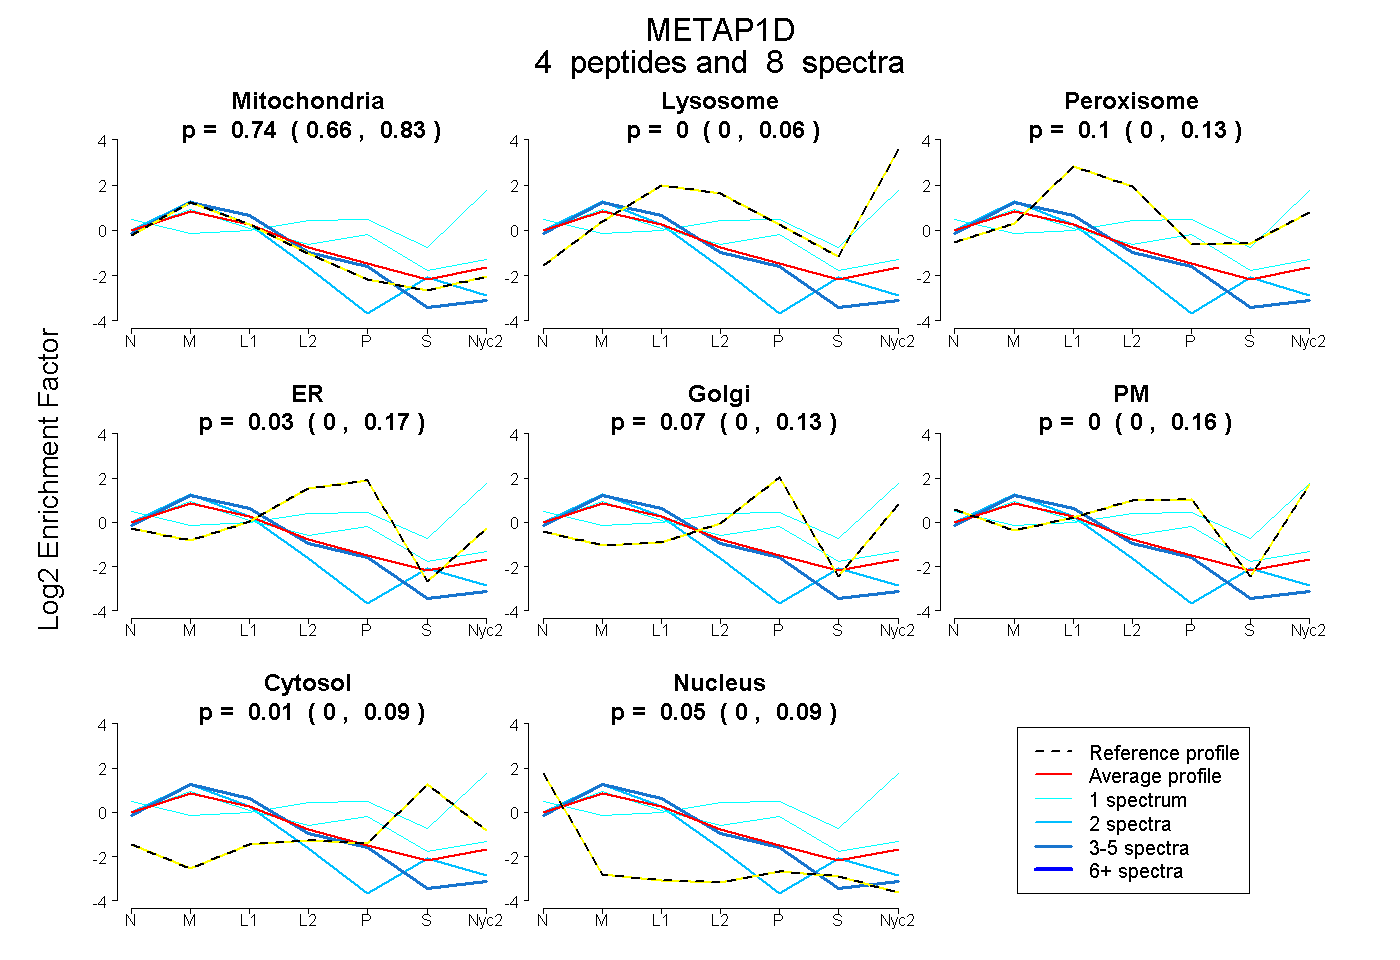
0.657 | 0.827
0.000 | 0.061
0.000 | 0.132
0.000 | 0.172
0.000 | 0.125
0.000 | 0.157
0.000 | 0.091
0.000 | 0.095
1peptide
spectrum
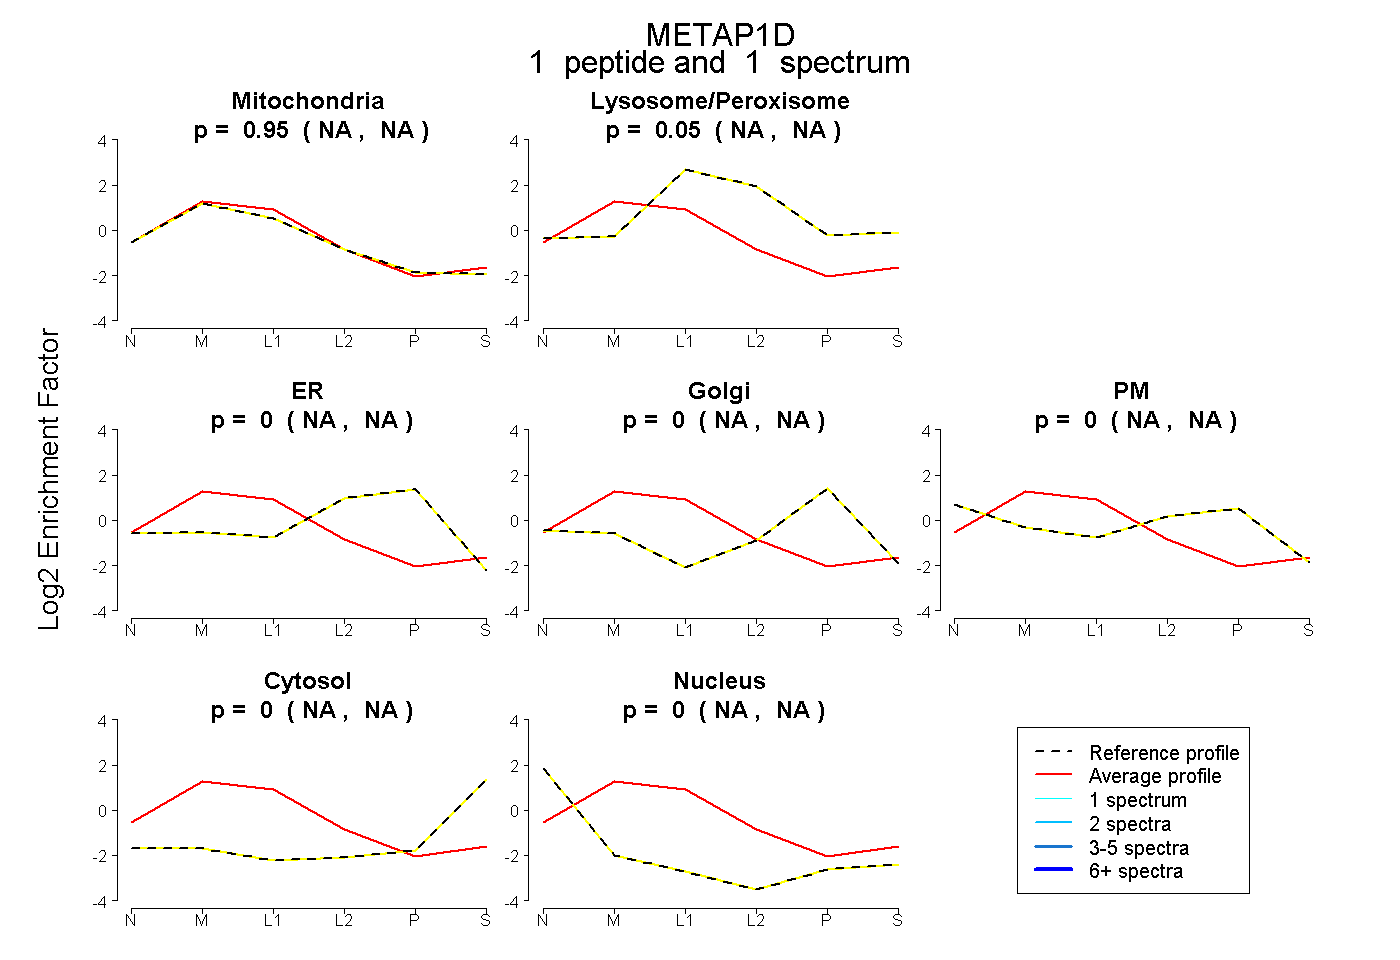
NA | NA
NA | NA
NA | NA
NA | NA
NA | NA
NA | NA
NA | NA
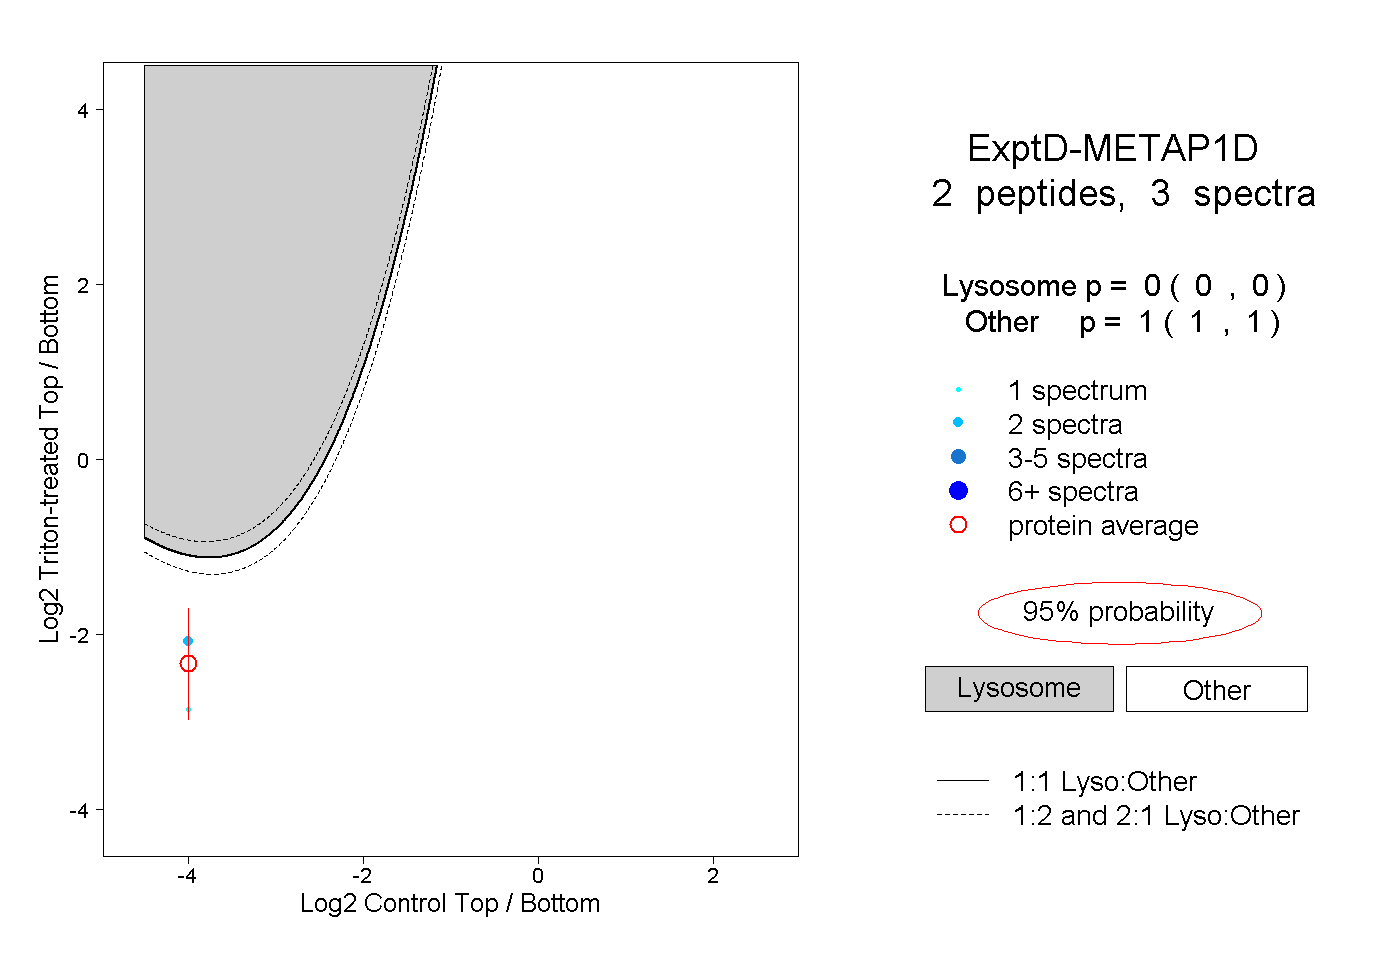
7peptides
spectra
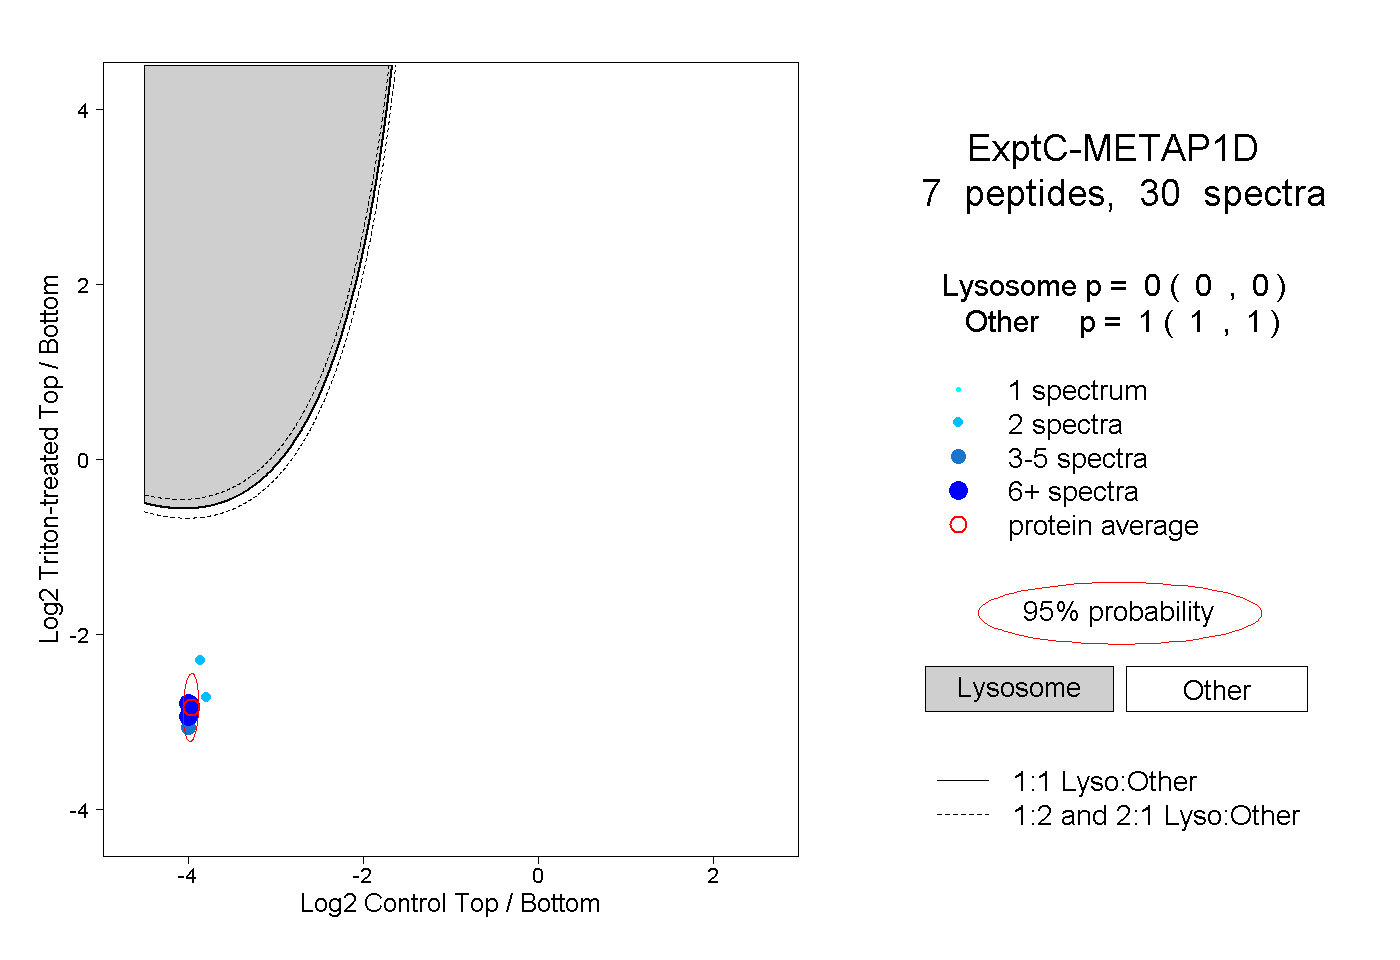
0.000 | 0.000
1.000 | 1.000