FAM120B
[ENSRNOP00000002036]
Main page
| | | Plot |
Mito |
Lyso |
|
Perox |
ER |
Golgi |
PM |
Cytosol |
Nucleus |
|
| Expt A |
 7
7
peptides |
18
spectra |
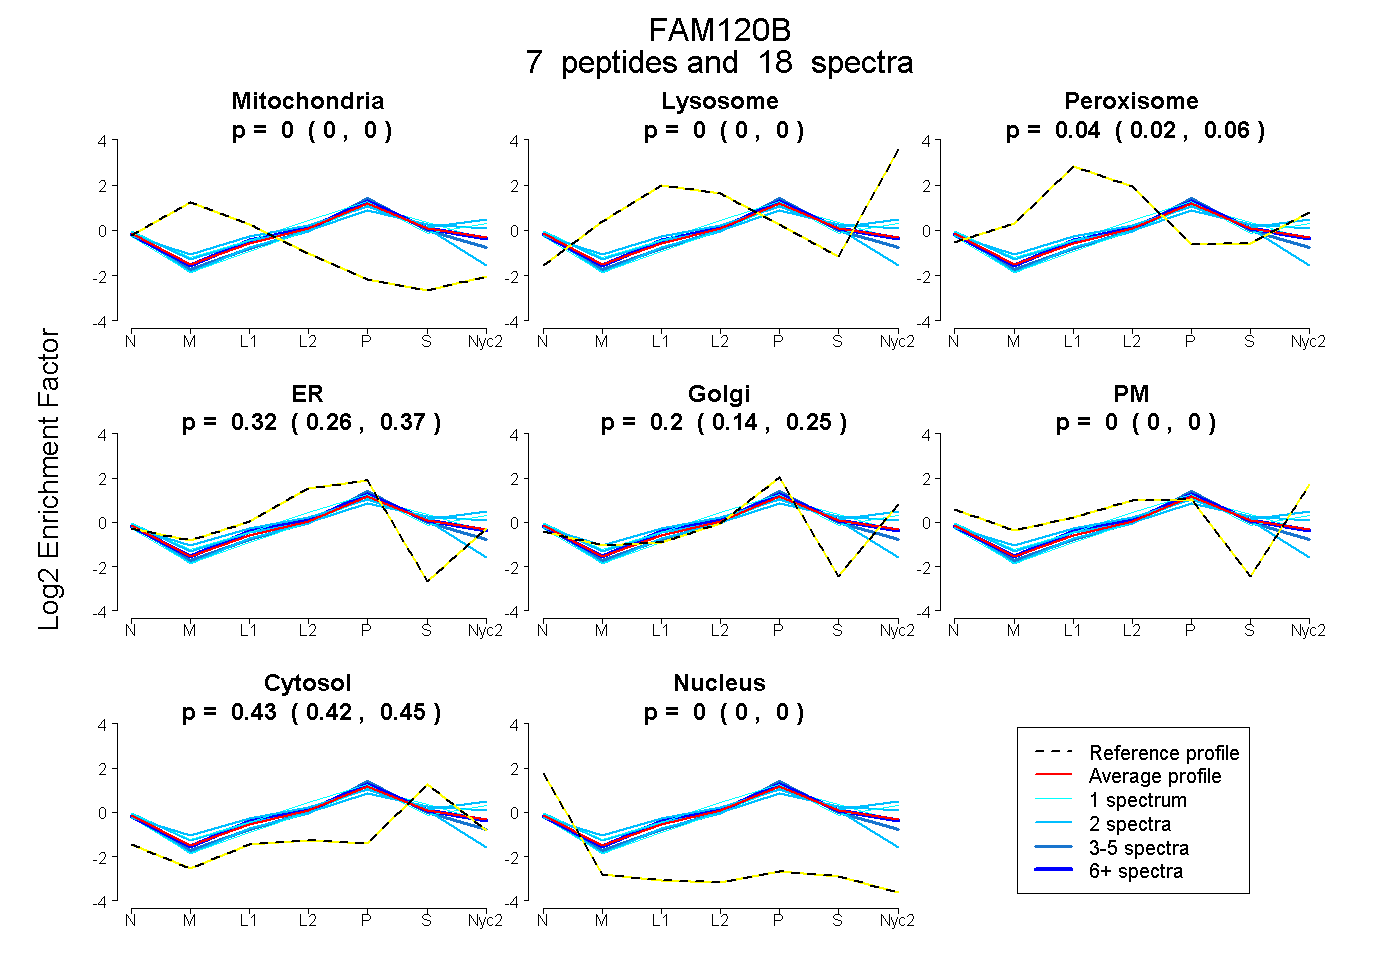 |
0.000
0.000 | 0.000 |
0.000
0.000 | 0.000 |
|
0.045
0.025 | 0.061 |
0.323
0.256 | 0.375 |
0.200
0.143 | 0.247 |
0.000
0.000 | 0.000 |
0.432
0.416 | 0.445 |
0.000
0.000 | 0.000 |
|
| | | Plot |
Mito |
|
Lyso or Perox |
|
ER |
Golgi |
PM |
Cytosol |
Nucleus |
|
| Expt B |
1
peptide |
1
spectrum |
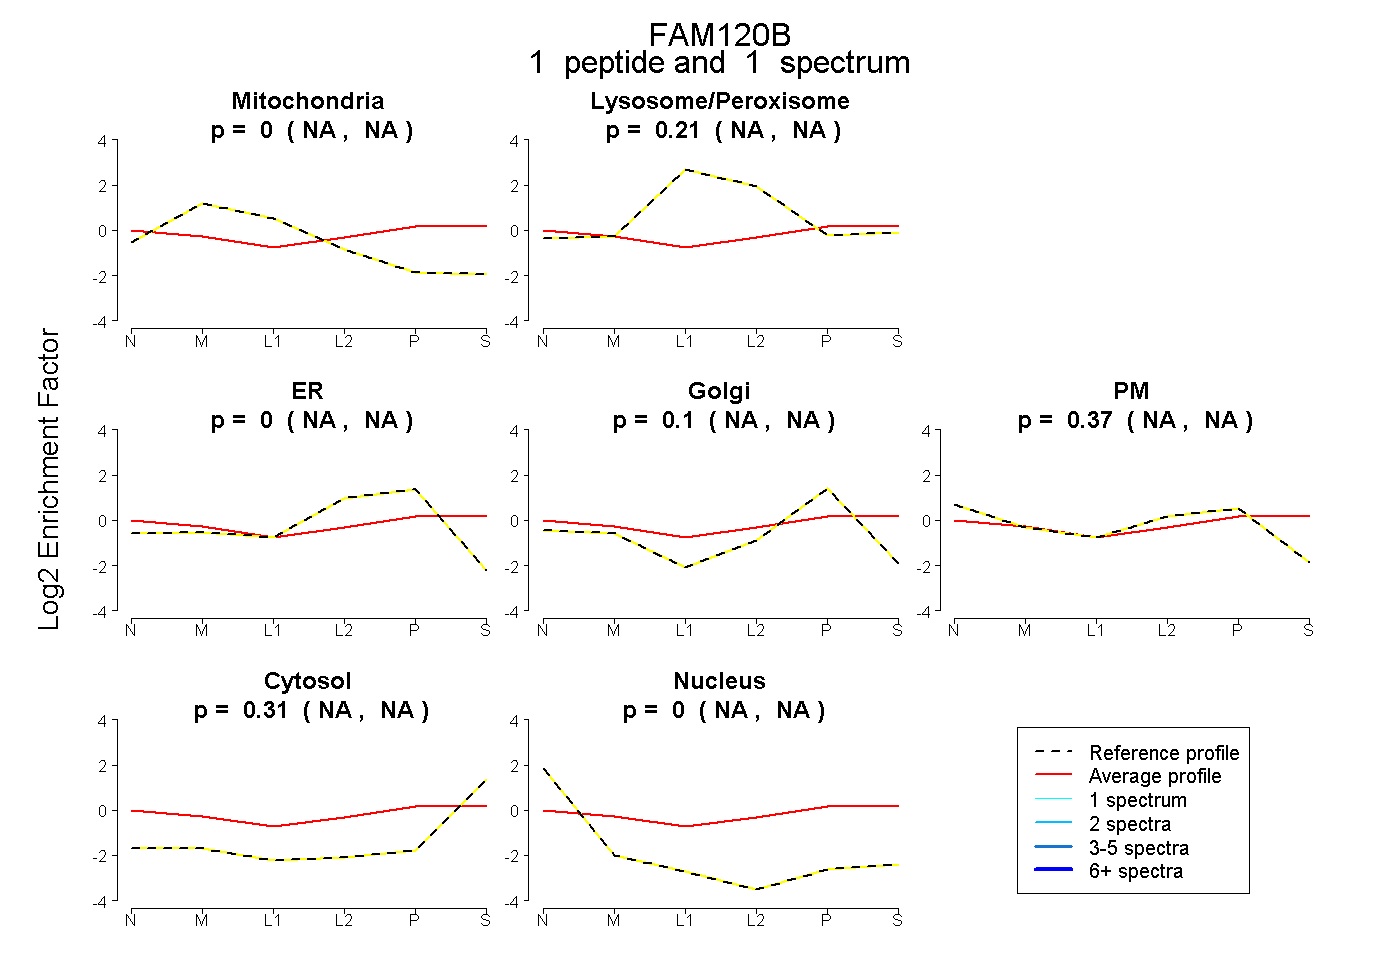 |
0.000
NA | NA |
|
0.212
NA | NA |
|
0.000
NA | NA |
0.104
NA | NA |
0.375
NA | NA |
0.310
NA | NA |
0.000
NA | NA |
|
| | | Plot |
|
Lyso |
|
|
|
|
|
|
|
Other |
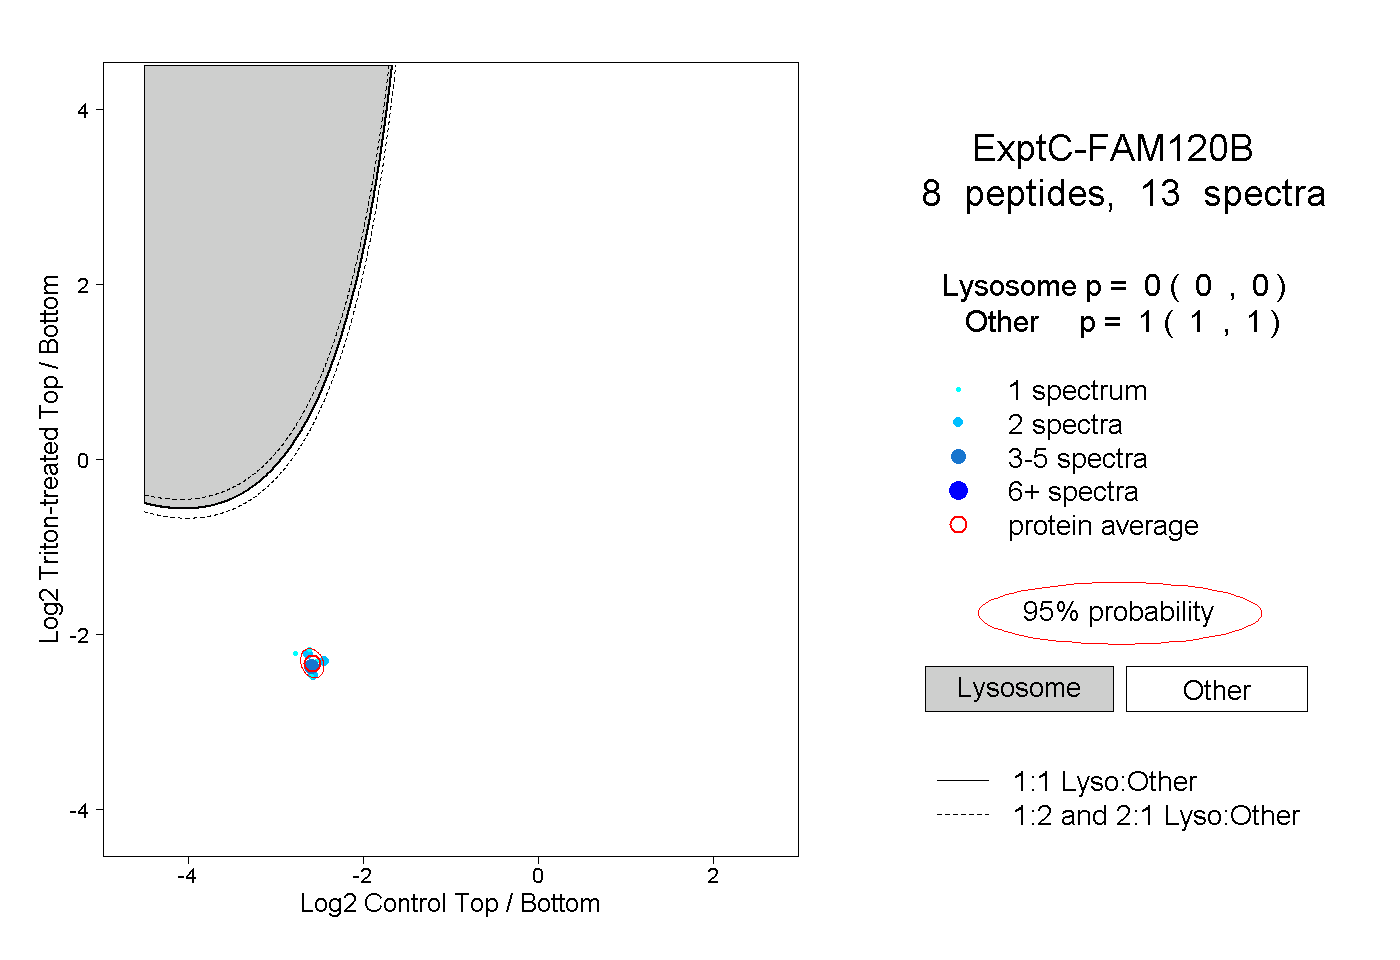
| Expt C |
8
peptides |
13
spectra |
 |
|
0.000
0.000 | 0.000 |
|
|
|
|
|
|
|
1.000
1.000 | 1.000 |
| 1 spectrum, DGASTGPVVK |
|
0.000 |
|
|
|
|
|
|
|
1.000 |
| 2 spectra, IFHYIK |
|
0.000 |
|
|
|
|
|
|
|
1.000 |
| 2 spectra, AVQLGSLLVR |
|
0.000 |
|
|
|
|
|
|
|
1.000 |
| 2 spectra, EELQSVESPLR |
|
0.000 |
|
|
|
|
|
|
|
1.000 |
| 1 spectrum, GYGVETLLEQNR |
|
0.000 |
|
|
|
|
|
|
|
1.000 |
| 3 spectra, GVTSYLLPGQK |
|
0.000 |
|
|
|
|
|
|
|
1.000 |
| 1 spectrum, SPWLVQKPK |
|
0.000 |
|
|
|
|
|
|
|
1.000 |
| 1 spectrum, YIQESK |
|
0.000 |
|
|
|
|
|
|
|
1.000 |
| | | Plot |
|
Lyso |
|
|
|
|
|
|
|
Other |
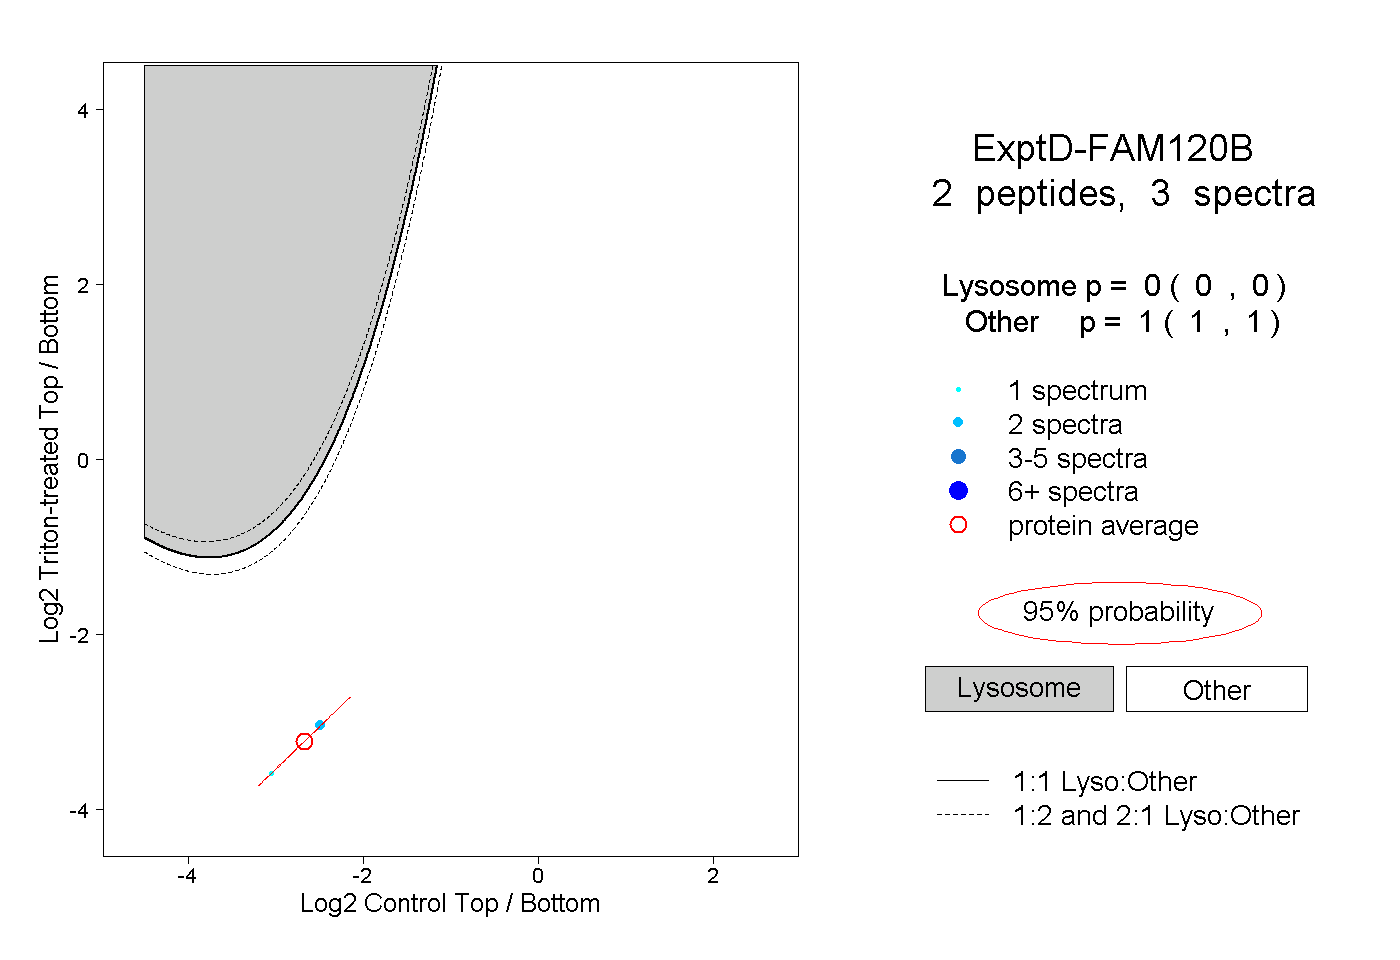
| Expt D |
2
peptides |
3
spectra |
 |
|
0.000
0.000 | 0.000 |
|
|
|
|
|
|
|
1.000
1.000 | 1.000 |