GTF2I
[ENSRNOP00000002020]
Main page
| | | Plot |
Mito |
Lyso |
|
Perox |
ER |
Golgi |
PM |
Cytosol |
Nucleus |
|
| Expt A |
 15
15
peptides |
28
spectra |
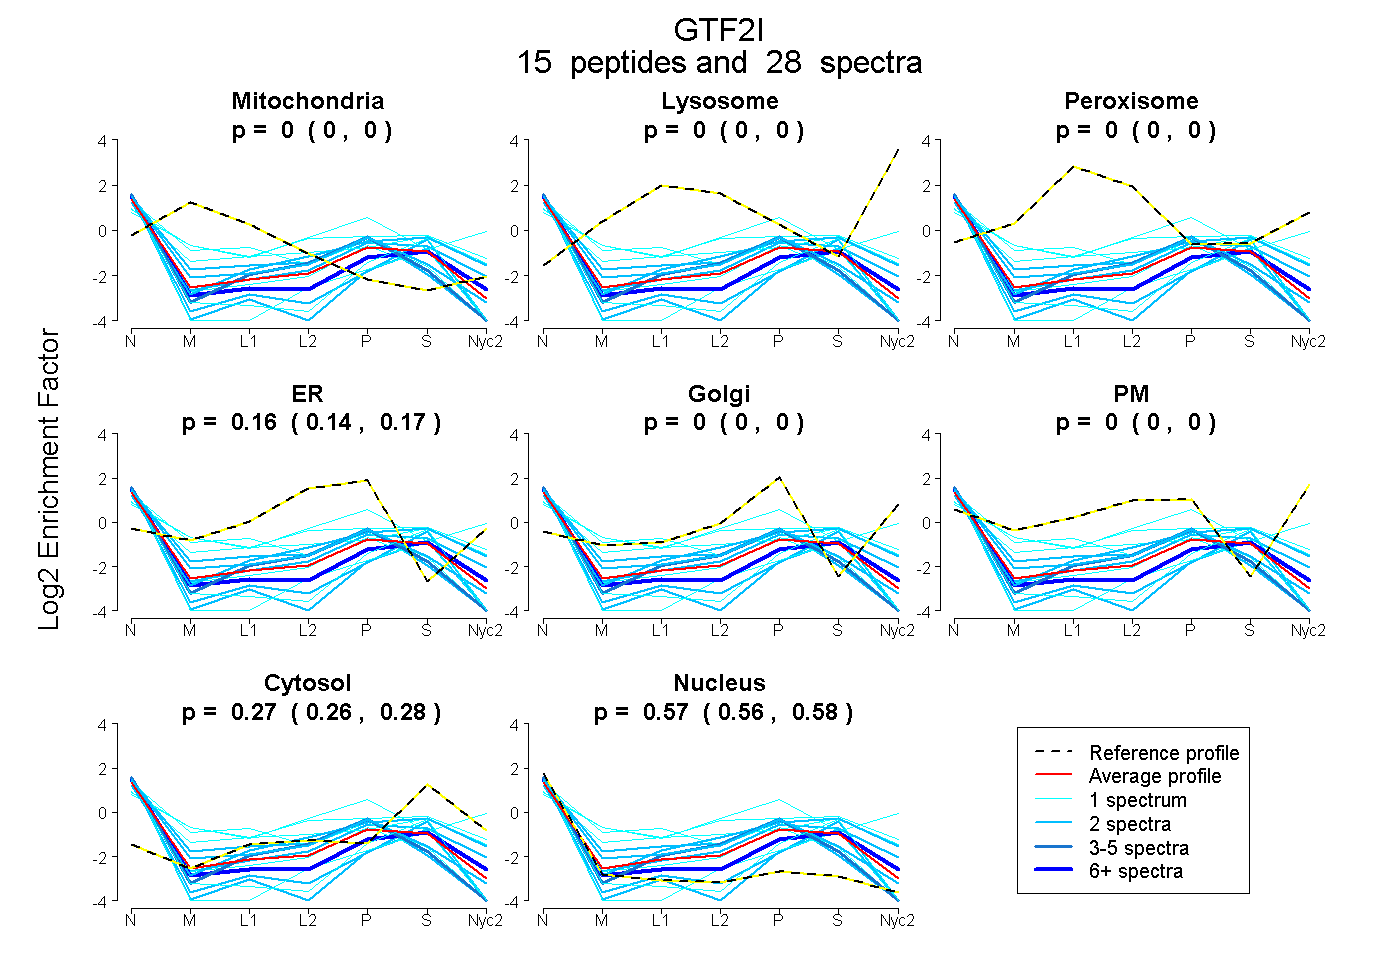 |
0.000
0.000 | 0.000 |
0.000
0.000 | 0.000 |
|
0.000
0.000 | 0.000 |
0.155
0.142 | 0.165 |
0.000
0.000 | 0.000 |
0.000
0.000 | 0.000 |
0.270
0.259 | 0.280 |
0.575
0.563 | 0.584 |
|
| | | Plot |
Mito |
|
Lyso or Perox |
|
ER |
Golgi |
PM |
Cytosol |
Nucleus |
|
| Expt B |
3
peptides |
4
spectra |
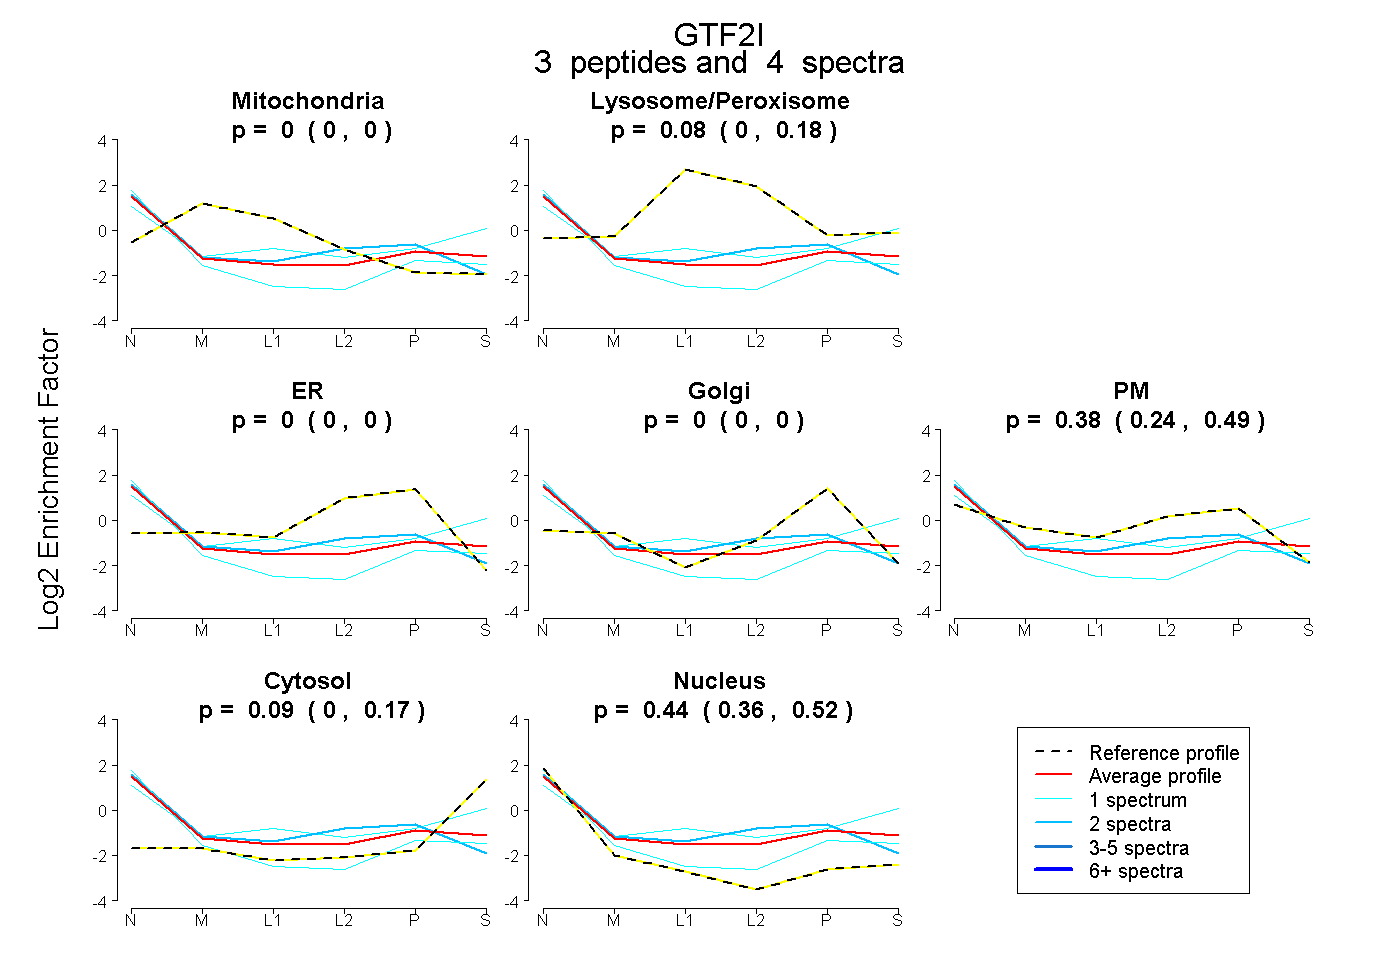 |
0.000
0.000 | 0.000 |
|
0.084
0.000 | 0.178 |
|
0.000
0.000 | 0.000 |
0.000
0.000 | 0.000 |
0.382
0.237 | 0.489 |
0.092
0.000 | 0.174 |
0.442
0.356 | 0.515 |
|
| 1 spectrum, QVEELFER |
0.000 |
|
0.000 |
|
0.000 |
0.080 |
0.178 |
0.072 |
0.669 |
|
| 1 spectrum, FAEALGSTEAK |
0.000 |
|
0.263 |
|
0.000 |
0.000 |
0.183 |
0.251 |
0.303 |
|
| 2 spectra, IIQVGNR |
0.000 |
|
0.036 |
|
0.000 |
0.000 |
0.604 |
0.000 |
0.360 |
|
| | | Plot |
|
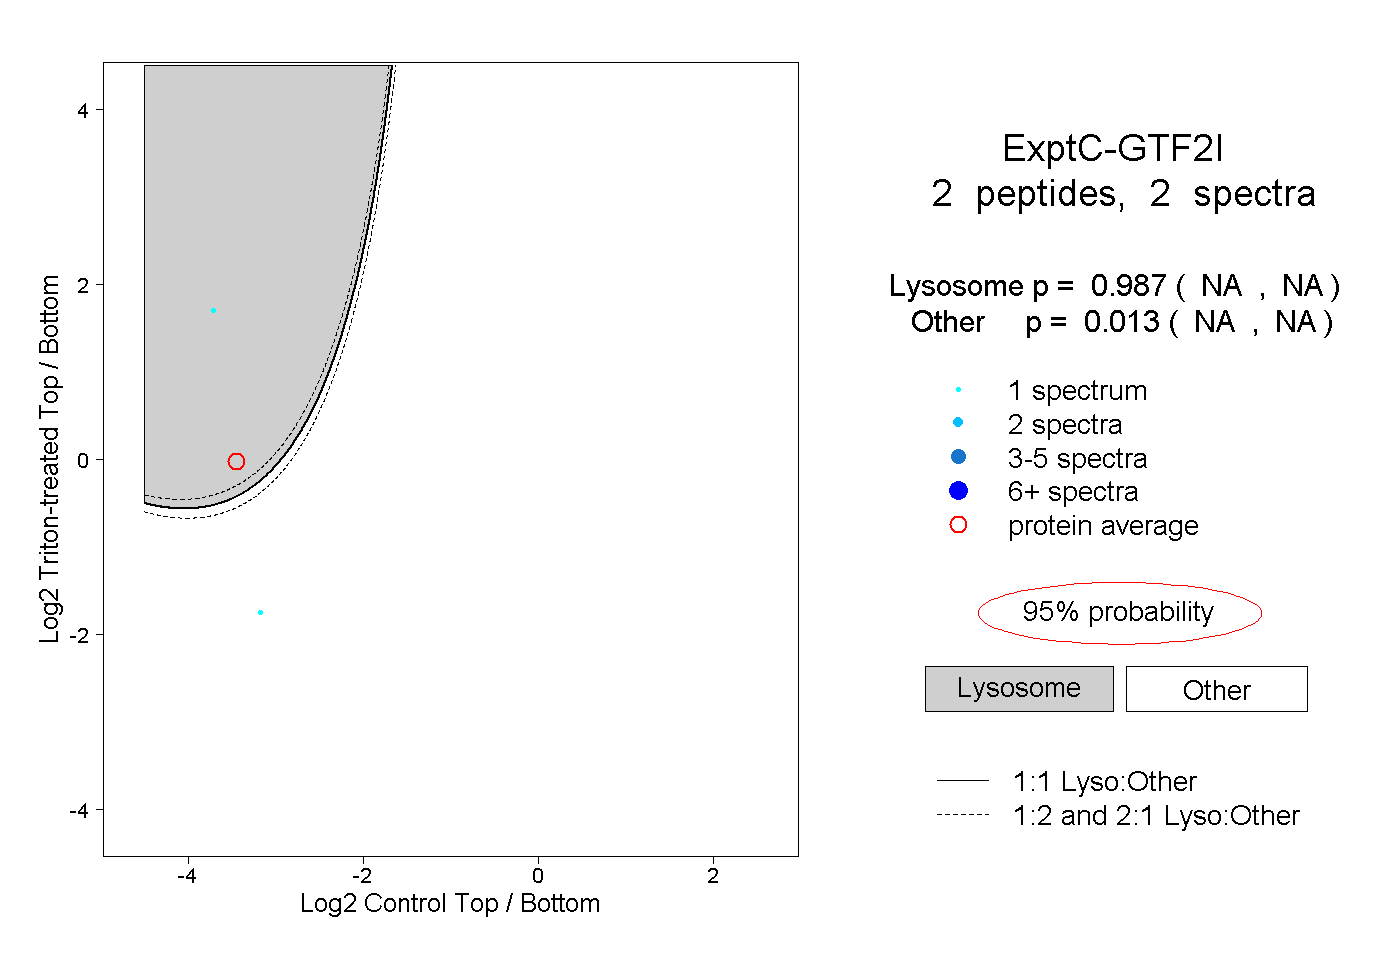
Lyso |
|
|
|
|
|
|
|
Other |
| Expt C |
2
peptides |
2
spectra |
 |
|
0.987
NA | NA |
|
|
|
|
|
|
|
0.013
NA | NA |