 15
15peptides
spectra
0.000 | 0.000
0.000 | 0.000
0.000 | 0.000
0.142 | 0.165
0.000 | 0.000
0.000 | 0.000
0.259 | 0.280
0.563 | 0.584
| Plot | Mito | Lyso | Perox | ER | Golgi | PM | Cytosol | Nucleus | |||||
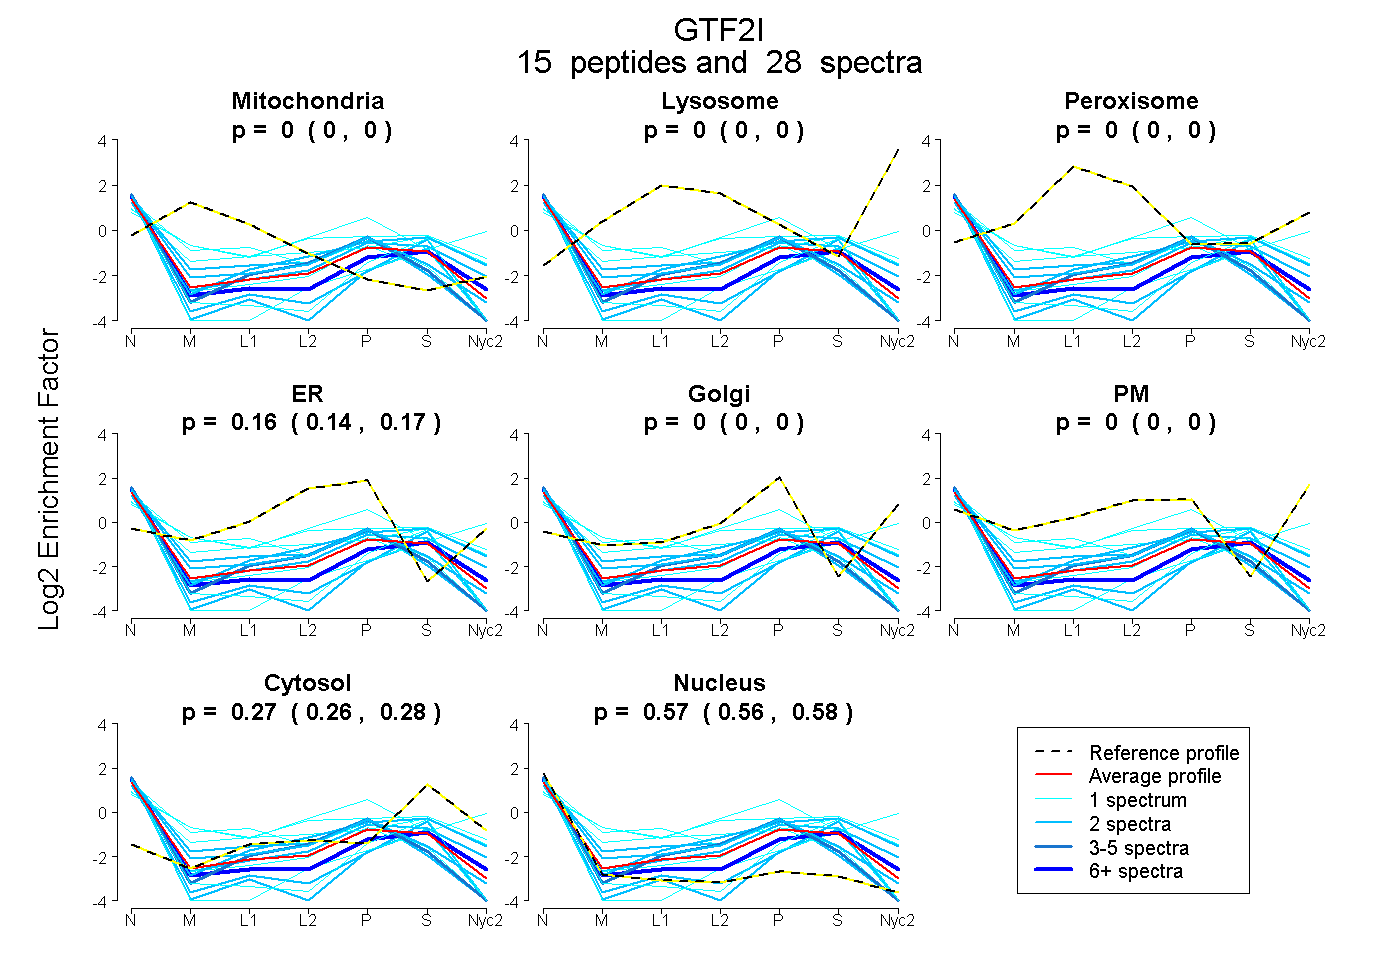
| Expt A |
15 peptides |
28 spectra |
|
0.000 0.000 | 0.000 |
0.000 0.000 | 0.000 |
0.000 0.000 | 0.000 |
0.155 0.142 | 0.165 |
0.000 0.000 | 0.000 |
0.000 0.000 | 0.000 |
0.270 0.259 | 0.280 |
0.575 0.563 | 0.584 |
| 1 spectrum, ILDSAEFIK | 0.000 | 0.000 | 0.000 | 0.000 | 0.000 | 0.000 | 0.194 | 0.806 | ||
| 1 spectrum, FAQALGLTEAVK | 0.000 | 0.000 | 0.000 | 0.000 | 0.152 | 0.465 | 0.252 | 0.132 | ||
| 2 spectra, AFVNTR | 0.000 | 0.000 | 0.000 | 0.000 | 0.000 | 0.000 | 0.177 | 0.823 | ||
| 3 spectra, SPTWFGIPR | 0.000 | 0.000 | 0.000 | 0.256 | 0.000 | 0.000 | 0.061 | 0.682 | ||
| 2 spectra, YAQAIK | 0.000 | 0.000 | 0.000 | 0.300 | 0.000 | 0.000 | 0.111 | 0.589 | ||
| 1 spectrum, AAEMHK | 0.000 | 0.000 | 0.095 | 0.162 | 0.000 | 0.150 | 0.357 | 0.235 | ||
| 1 spectrum, YCVEEEEK | 0.000 | 0.000 | 0.000 | 0.000 | 0.000 | 0.000 | 0.256 | 0.744 | ||
| 1 spectrum, QVEELFER | 0.267 | 0.000 | 0.008 | 0.233 | 0.000 | 0.000 | 0.019 | 0.473 | ||
| 1 spectrum, QVEEIFNLK | 0.000 | 0.000 | 0.000 | 0.182 | 0.000 | 0.000 | 0.075 | 0.742 | ||
| 6 spectra, RPSTFGIPR | 0.000 | 0.000 | 0.000 | 0.000 | 0.067 | 0.000 | 0.305 | 0.628 | ||
| 2 spectra, SPSWYGIPR | 0.000 | 0.000 | 0.000 | 0.121 | 0.000 | 0.106 | 0.428 | 0.345 | ||
| 2 spectra, AVPYQK | 0.013 | 0.000 | 0.000 | 0.346 | 0.000 | 0.000 | 0.000 | 0.641 | ||
| 2 spectra, AGISFIIK | 0.000 | 0.000 | 0.000 | 0.033 | 0.180 | 0.000 | 0.318 | 0.470 | ||
| 2 spectra, EQVNDLFSR | 0.000 | 0.000 | 0.000 | 0.000 | 0.000 | 0.000 | 0.267 | 0.733 | ||
| 1 spectrum, HPEHYDLATLK | 0.152 | 0.000 | 0.079 | 0.000 | 0.000 | 0.193 | 0.340 | 0.236 |
| Plot | Mito | Lyso or Perox | ER | Golgi | PM | Cytosol | Nucleus | ||||||
| Expt B |
3 peptides |
4 spectra |
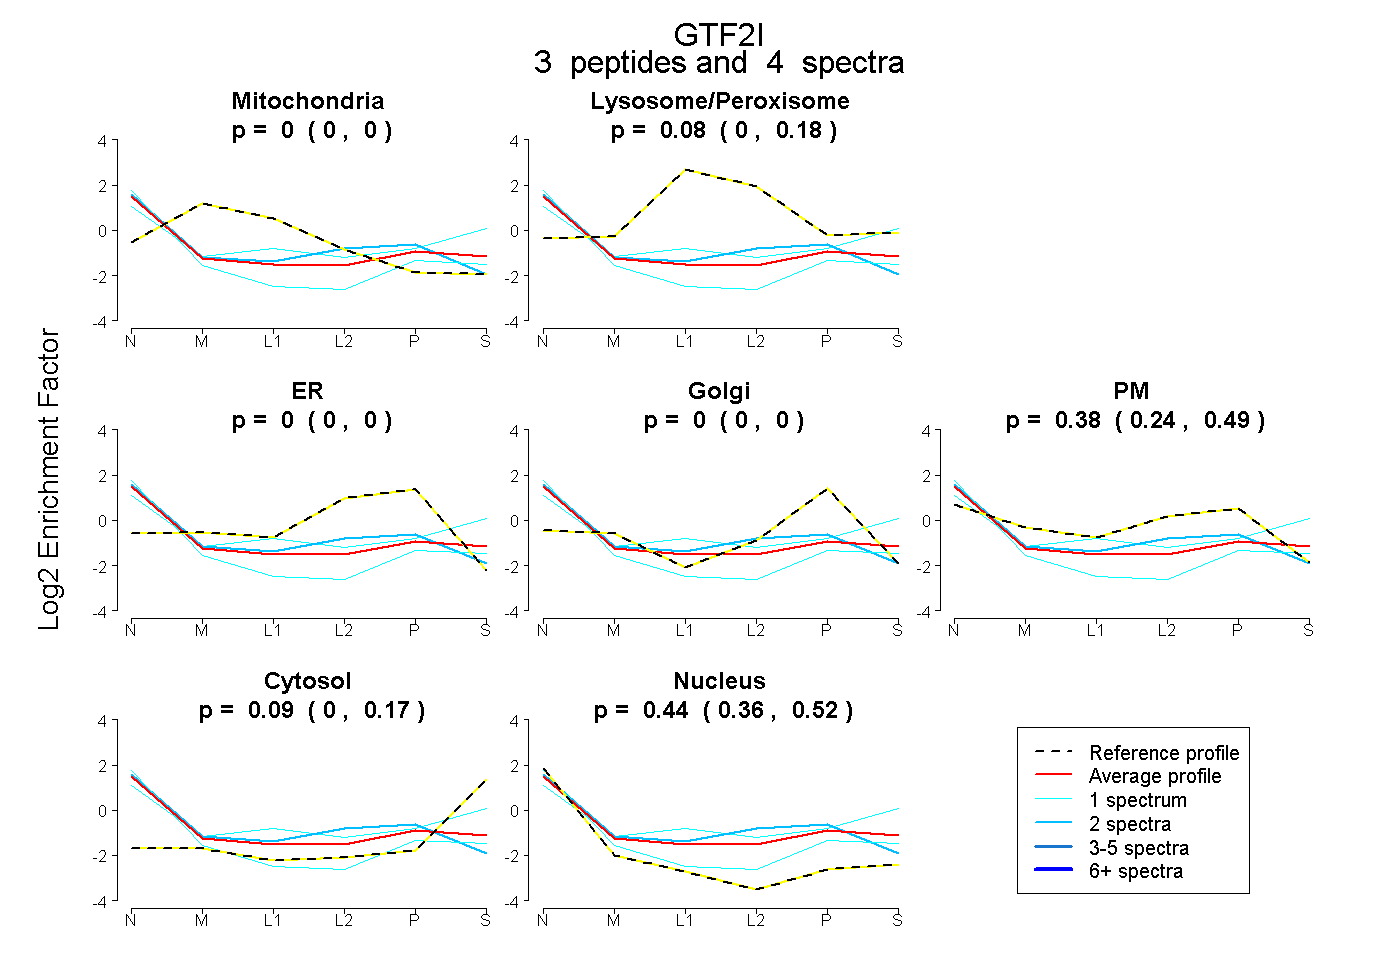 |
0.000 0.000 | 0.000 |
0.084 0.000 | 0.178 |
0.000 0.000 | 0.000 |
0.000 0.000 | 0.000 |
0.382 0.237 | 0.489 |
0.092 0.000 | 0.174 |
0.442 0.356 | 0.515 |
|||
| Plot | Lyso | Other | |||||||||||
| Expt C |
2 peptides |
2 spectra |
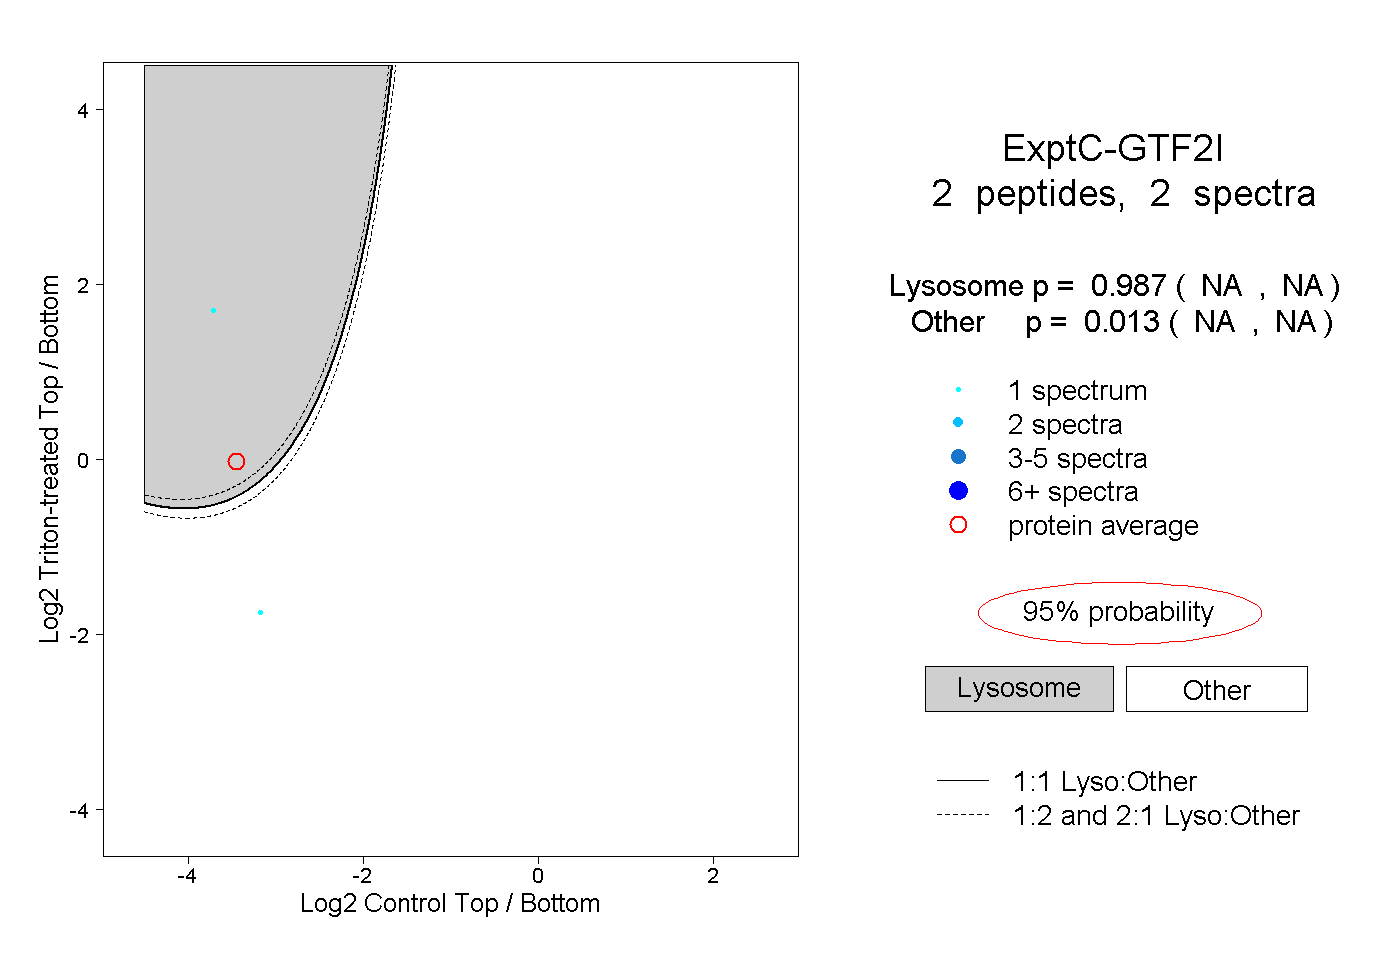 |
0.987 NA | NA |
0.013 NA | NA |