 4
4peptides
spectra
0.000 | 0.000
0.000 | 0.000
0.000 | 0.049
0.163 | 0.365
0.000 | 0.148
0.000 | 0.000
0.189 | 0.237
0.385 | 0.459
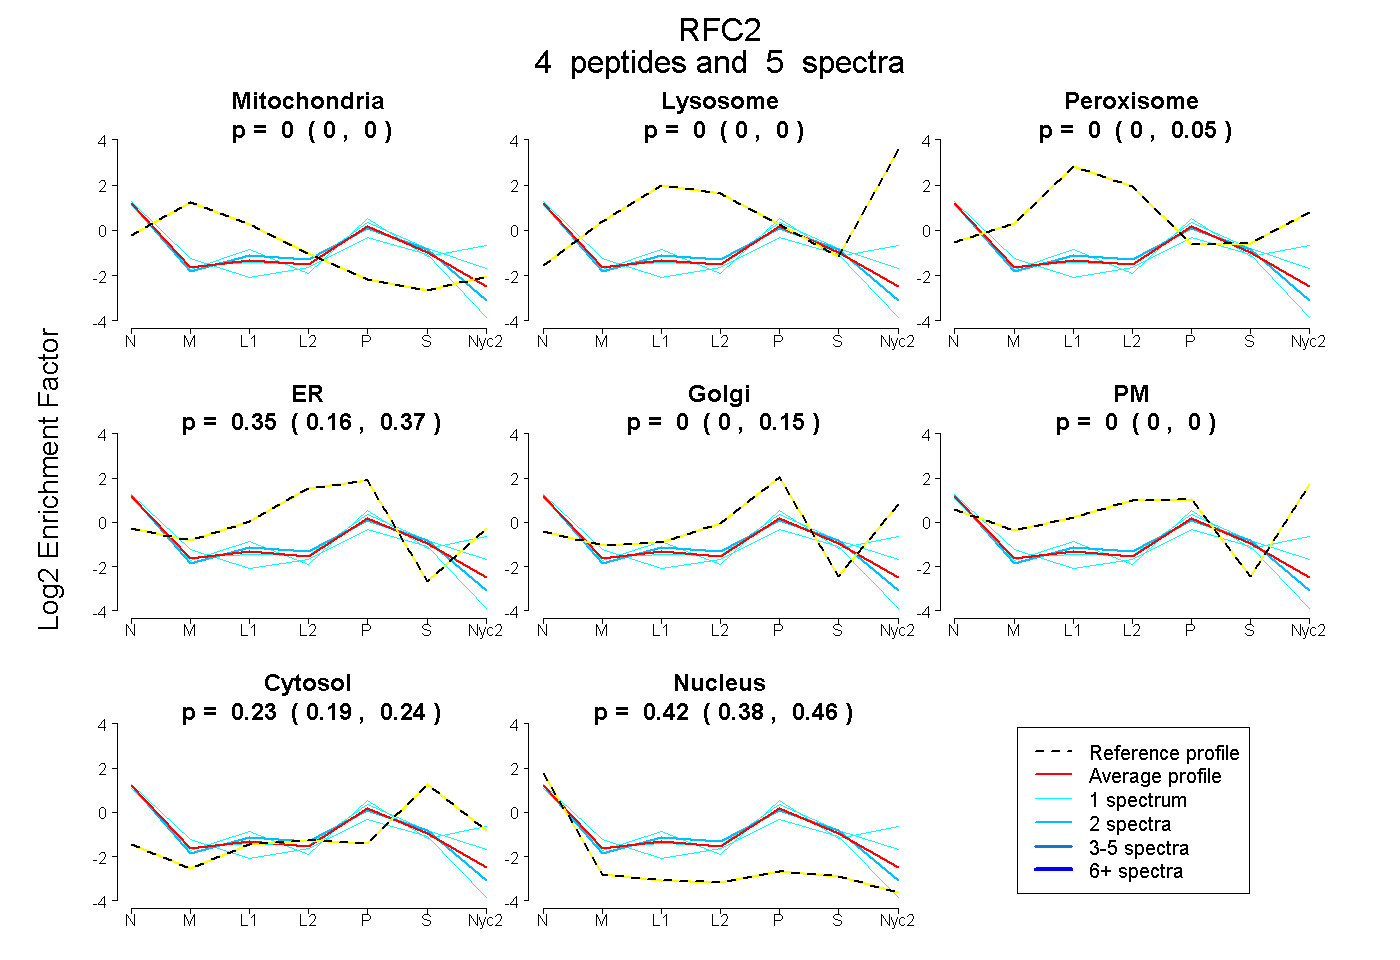
| Plot | Mito | Lyso | Perox | ER | Golgi | PM | Cytosol | Nucleus | |||||
| Expt A |
4 peptides |
5 spectra |
|
0.000 0.000 | 0.000 |
0.000 0.000 | 0.000 |
0.000 0.000 | 0.049 |
0.352 0.163 | 0.365 |
0.000 0.000 | 0.148 |
0.000 0.000 | 0.000 |
0.226 0.189 | 0.237 |
0.422 0.385 | 0.459 |
| 1 spectrum, ALLGPALK | 0.000 | 0.000 | 0.006 | 0.139 | 0.272 | 0.000 | 0.246 | 0.337 | ||
| 2 spectra, VCDEPHPLLVK | 0.000 | 0.000 | 0.003 | 0.334 | 0.000 | 0.000 | 0.225 | 0.438 | ||
| 1 spectrum, LTDAQVLSR | 0.061 | 0.000 | 0.000 | 0.233 | 0.000 | 0.000 | 0.141 | 0.565 | ||
| 1 spectrum, LEVFAR | 0.000 | 0.000 | 0.000 | 0.000 | 0.347 | 0.171 | 0.189 | 0.293 |