 2
2peptides
spectra
0.000 | 0.000
0.038 | 0.152
0.000 | 0.075
0.000 | 0.000
0.000 | 0.000
0.248 | 0.345
0.537 | 0.603
0.000 | 0.000
4peptides
spectra
0.000 | 0.999
0.001 | 1.000
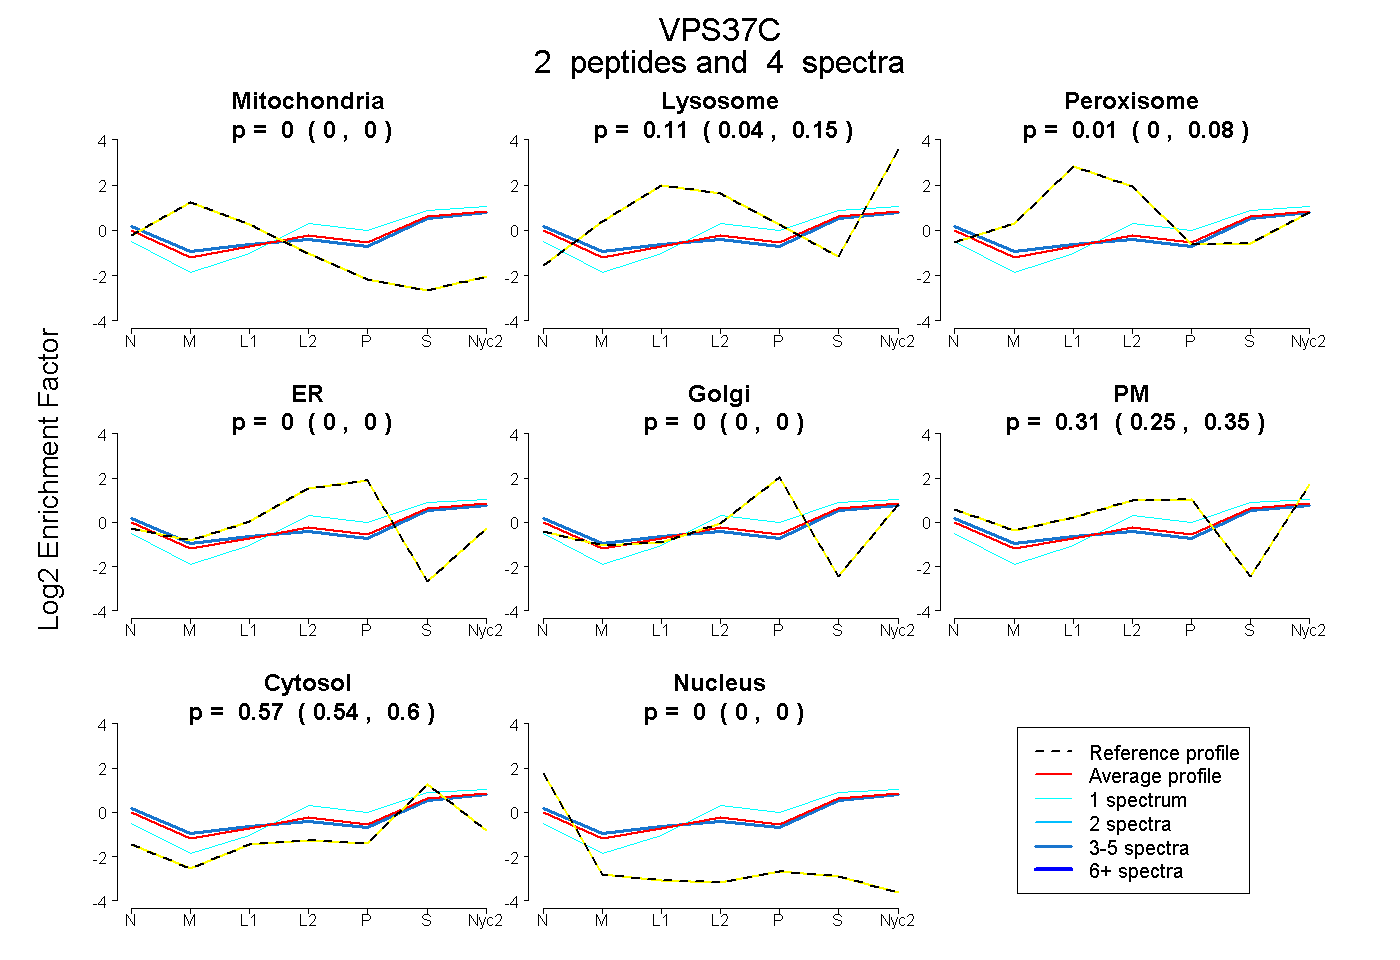
| Plot | Mito | Lyso | Perox | ER | Golgi | PM | Cytosol | Nucleus | |||||
| Expt A |
2 peptides |
4 spectra |
|
0.000 0.000 | 0.000 |
0.112 0.038 | 0.152 |
0.009 0.000 | 0.075 |
0.000 0.000 | 0.000 |
0.000 0.000 | 0.000 |
0.305 0.248 | 0.345 |
0.575 0.537 | 0.603 |
0.000 0.000 | 0.000 |
||
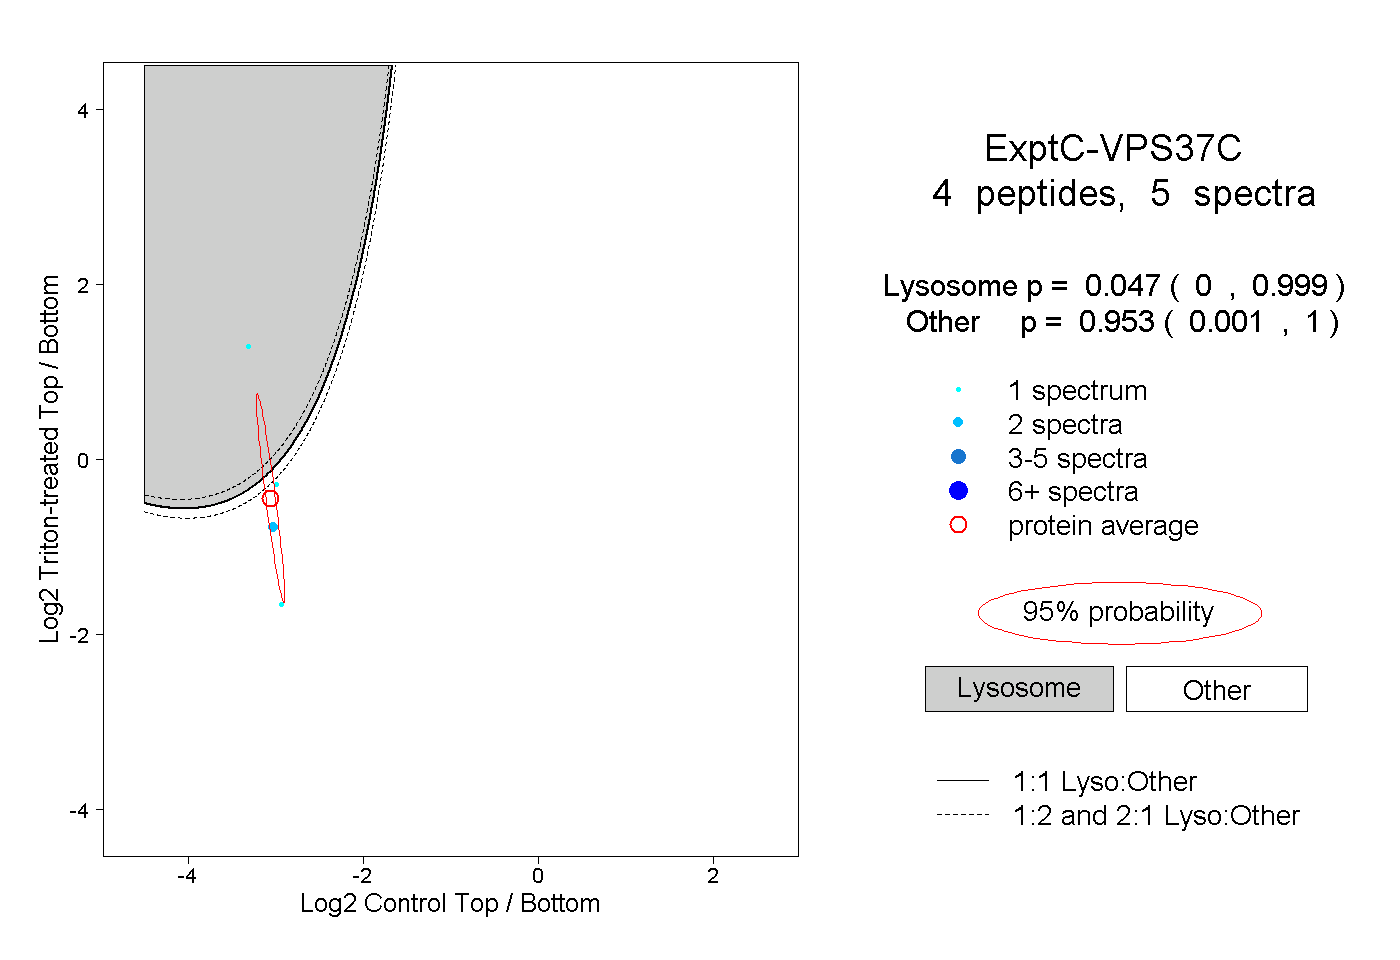
| Plot | Lyso | Other | |||||||||||
| Expt C |
4 peptides |
5 spectra |
|
0.047 0.000 | 0.999 |
0.953 0.001 | 1.000 |
| 1 spectrum, IEEESEAMAEK | 1.000 | 0.000 | ||||||||
| 2 spectra, LQDVVR | 0.001 | 0.999 | ||||||||
| 1 spectrum, TLLHLR | 0.109 | 0.891 | ||||||||
| 1 spectrum, EMALATNR | 0.000 | 1.000 |