 11
11peptides
spectra
0.000 | 0.000
0.000 | 0.000
0.000 | 0.018
0.028 | 0.198
0.000 | 0.013
0.000 | 0.153
0.076 | 0.143
0.663 | 0.712
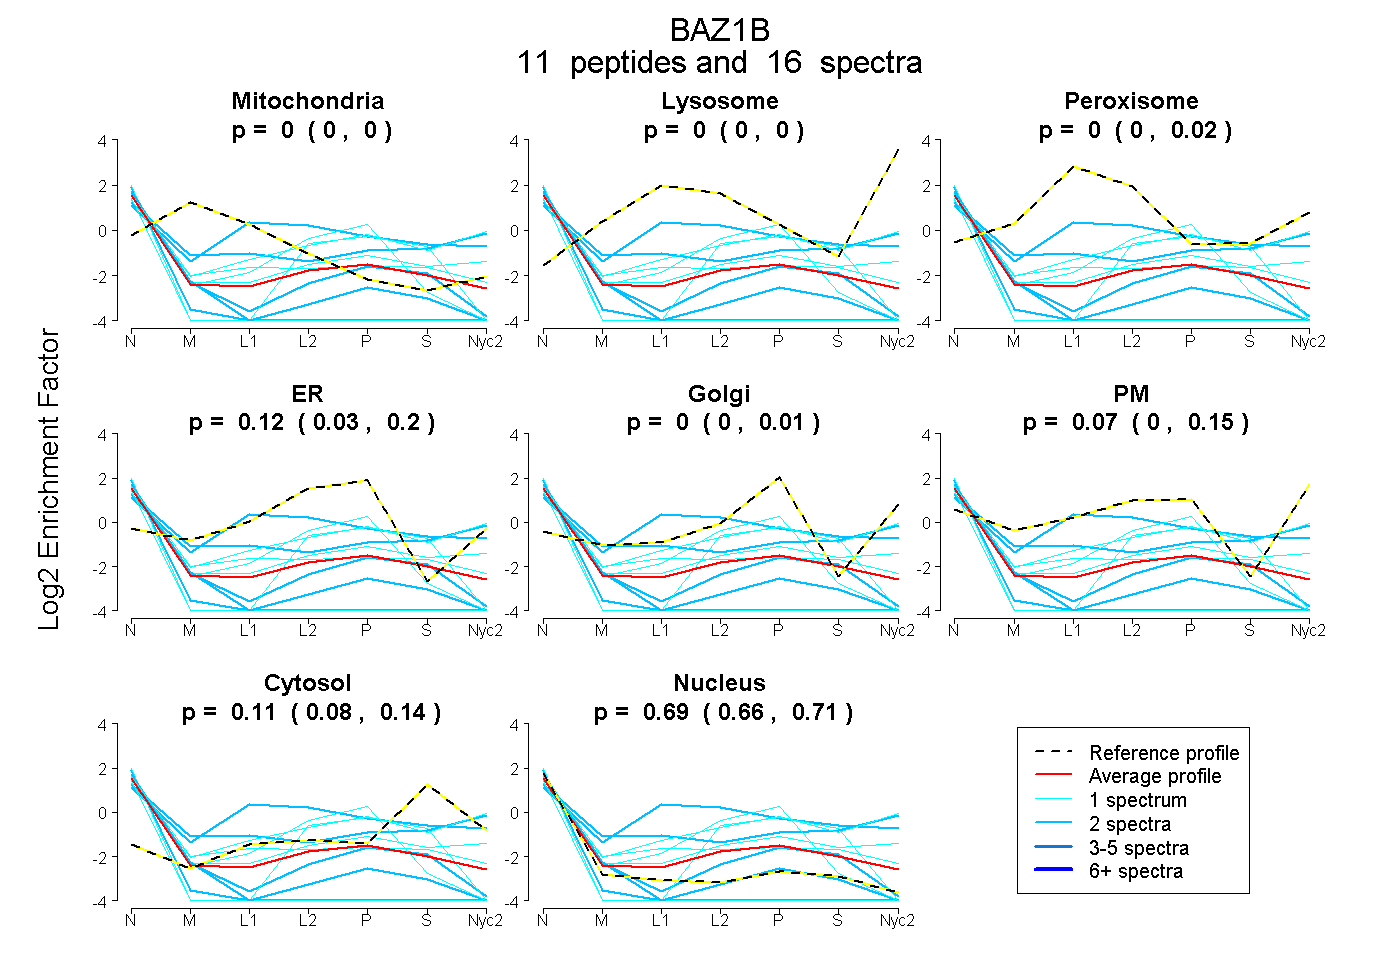
| Plot | Mito | Lyso | Perox | ER | Golgi | PM | Cytosol | Nucleus | |||||
| Expt A |
11 peptides |
16 spectra |
|
0.000 0.000 | 0.000 |
0.000 0.000 | 0.000 |
0.000 0.000 | 0.018 |
0.125 0.028 | 0.198 |
0.000 0.000 | 0.013 |
0.074 0.000 | 0.153 |
0.114 0.076 | 0.143 |
0.688 0.663 | 0.712 |