 26
26peptides
spectra
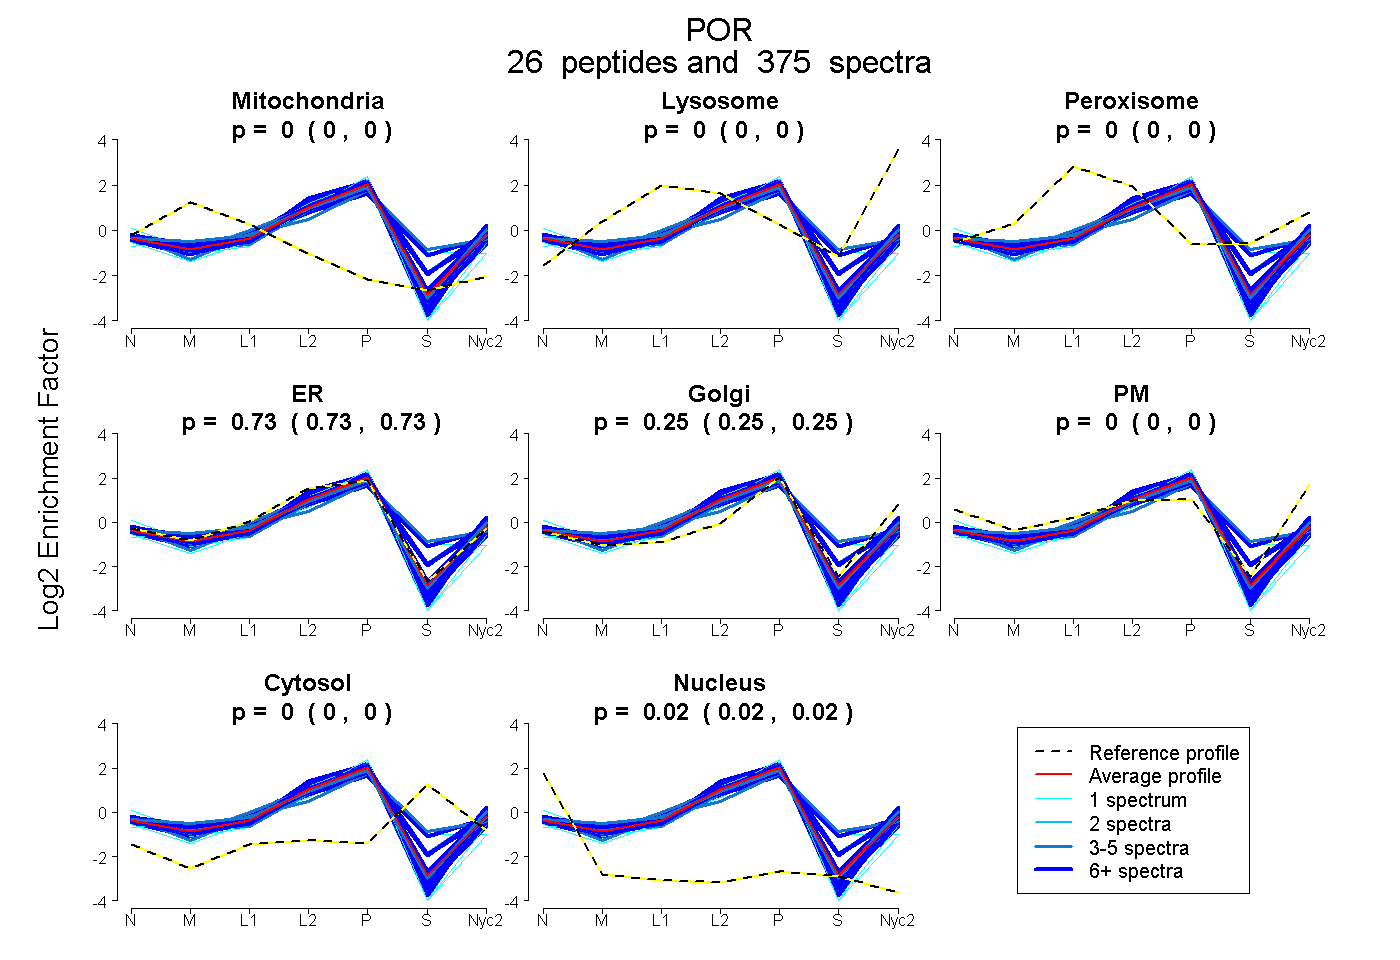
0.000 | 0.000
0.000 | 0.000
0.000 | 0.000
0.729 | 0.732
0.249 | 0.253
0.000 | 0.000
0.000 | 0.000
0.018 | 0.018
22peptides
spectra
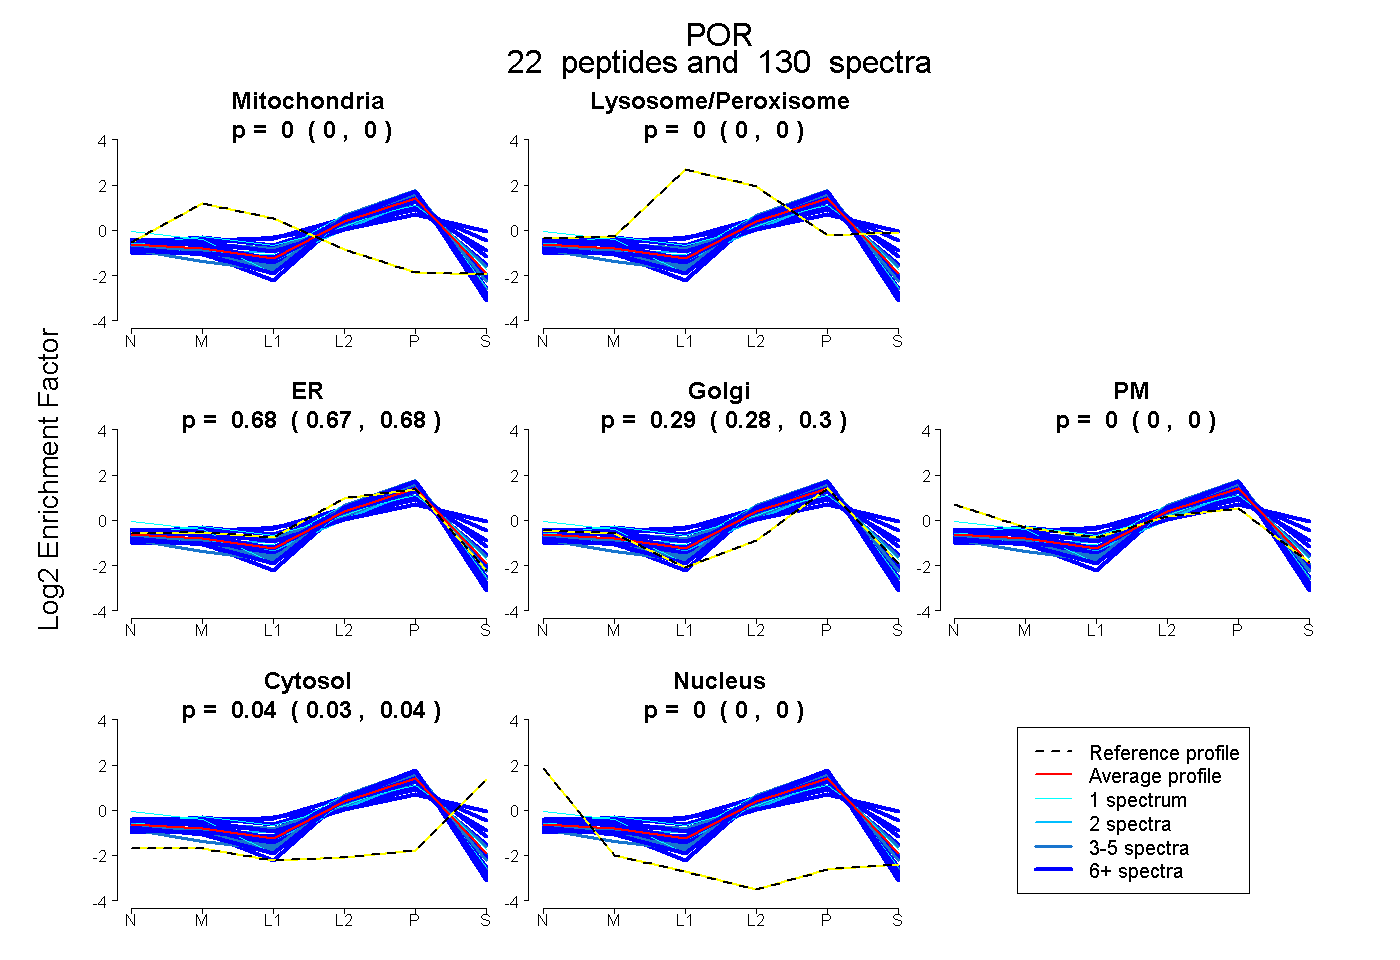
0.000 | 0.000
0.000 | 0.000
0.671 | 0.682
0.279 | 0.295
0.000 | 0.000
0.030 | 0.039
0.000 | 0.000
23peptides
spectra
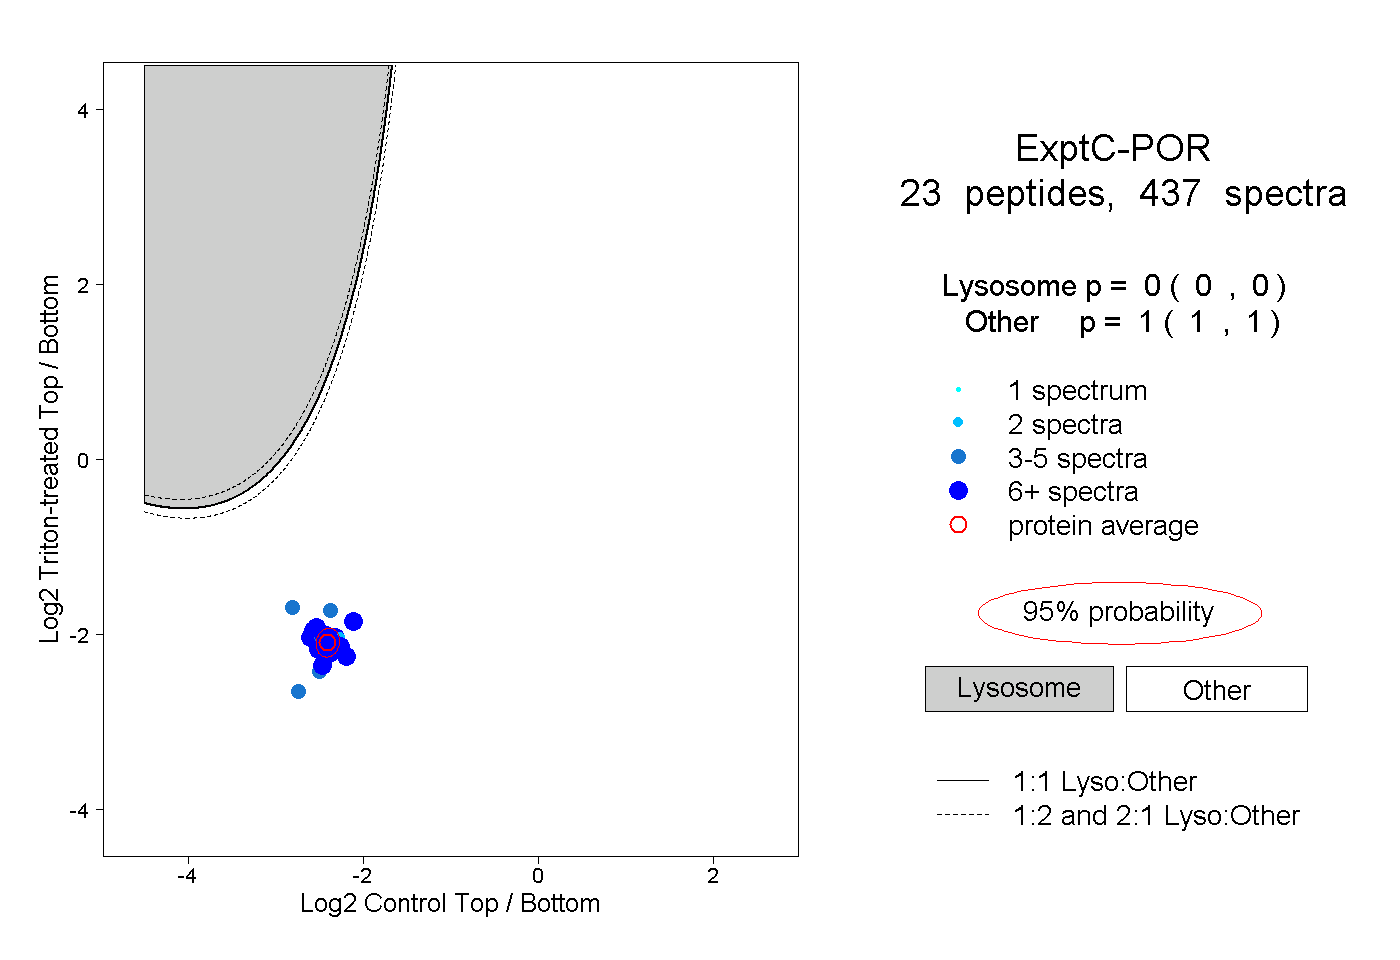
0.000 | 0.000
1.000 | 1.000
11peptides
spectra
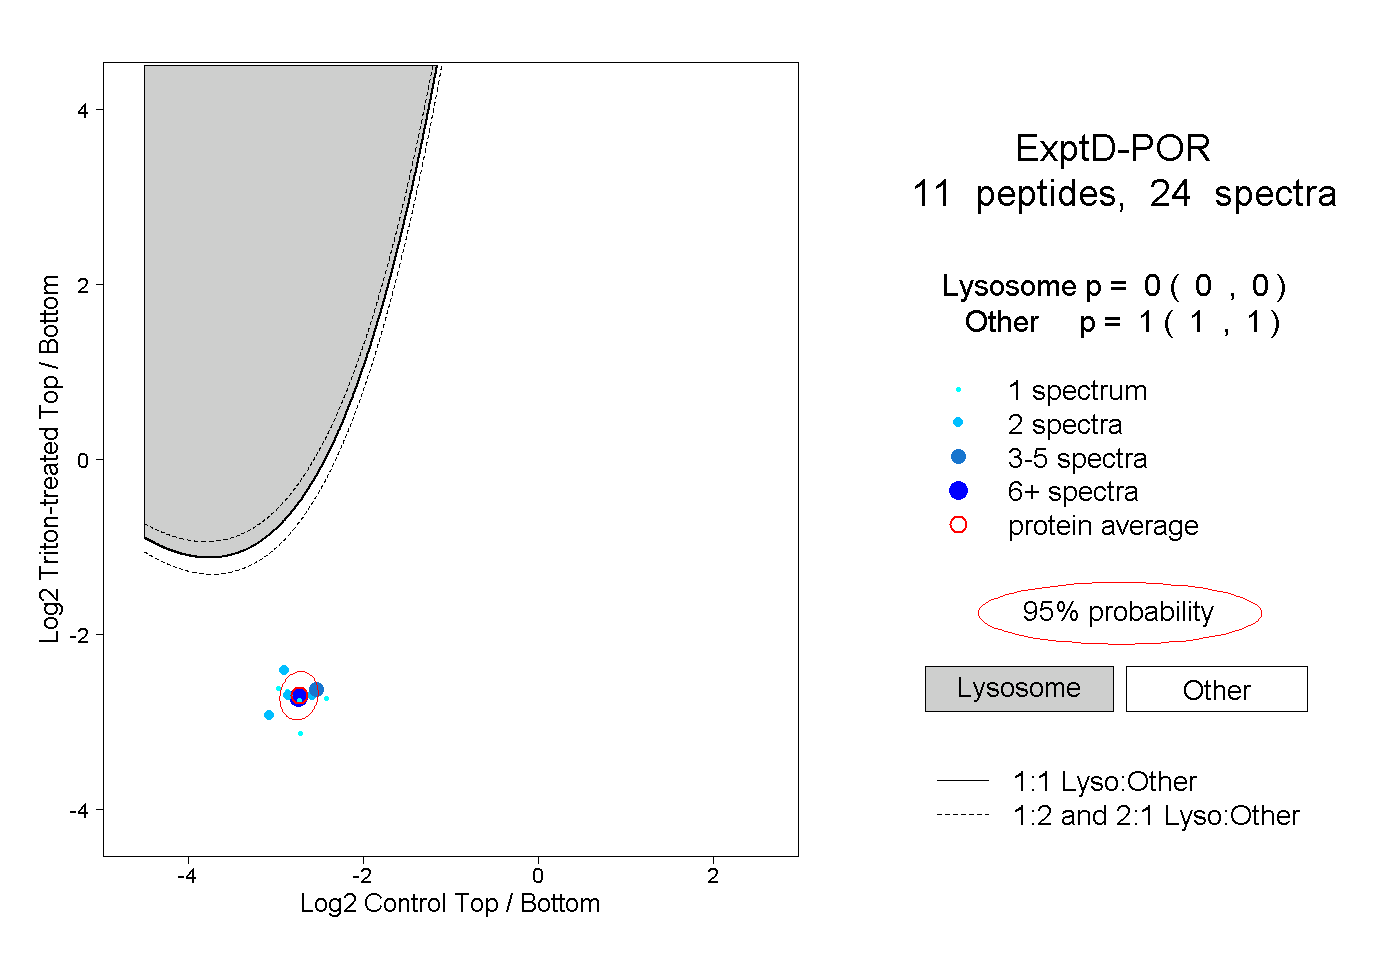
0.000 | 0.000
1.000 | 1.000