 20
20peptides
spectra
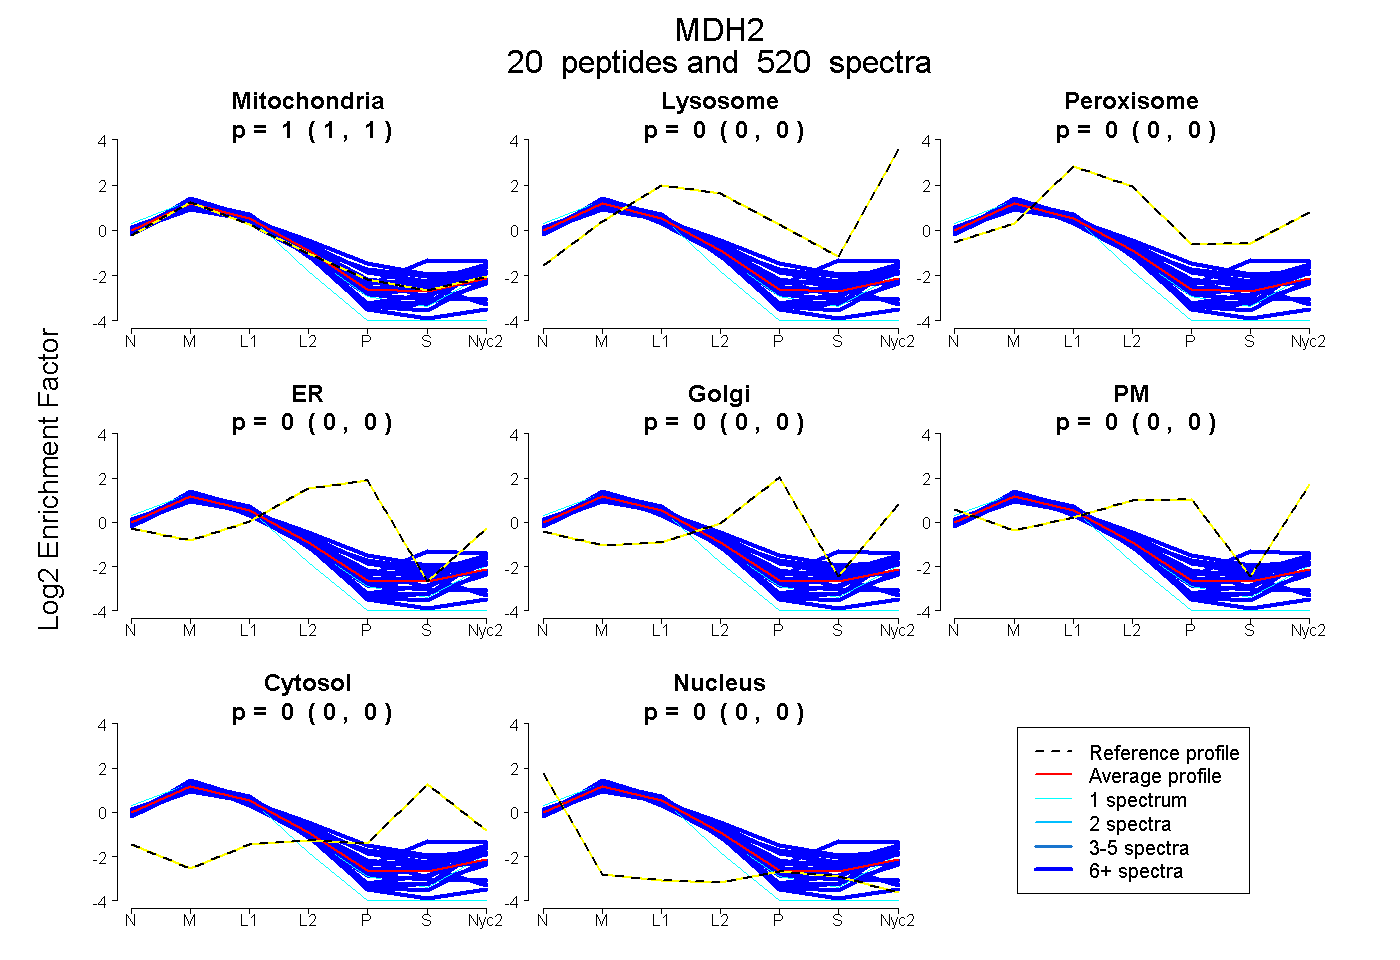
0.997 | 1.000
0.000 | 0.000
0.000 | 0.002
0.000 | 0.000
0.000 | 0.000
0.000 | 0.000
0.000 | 0.000
0.000 | 0.000
21peptides
spectra
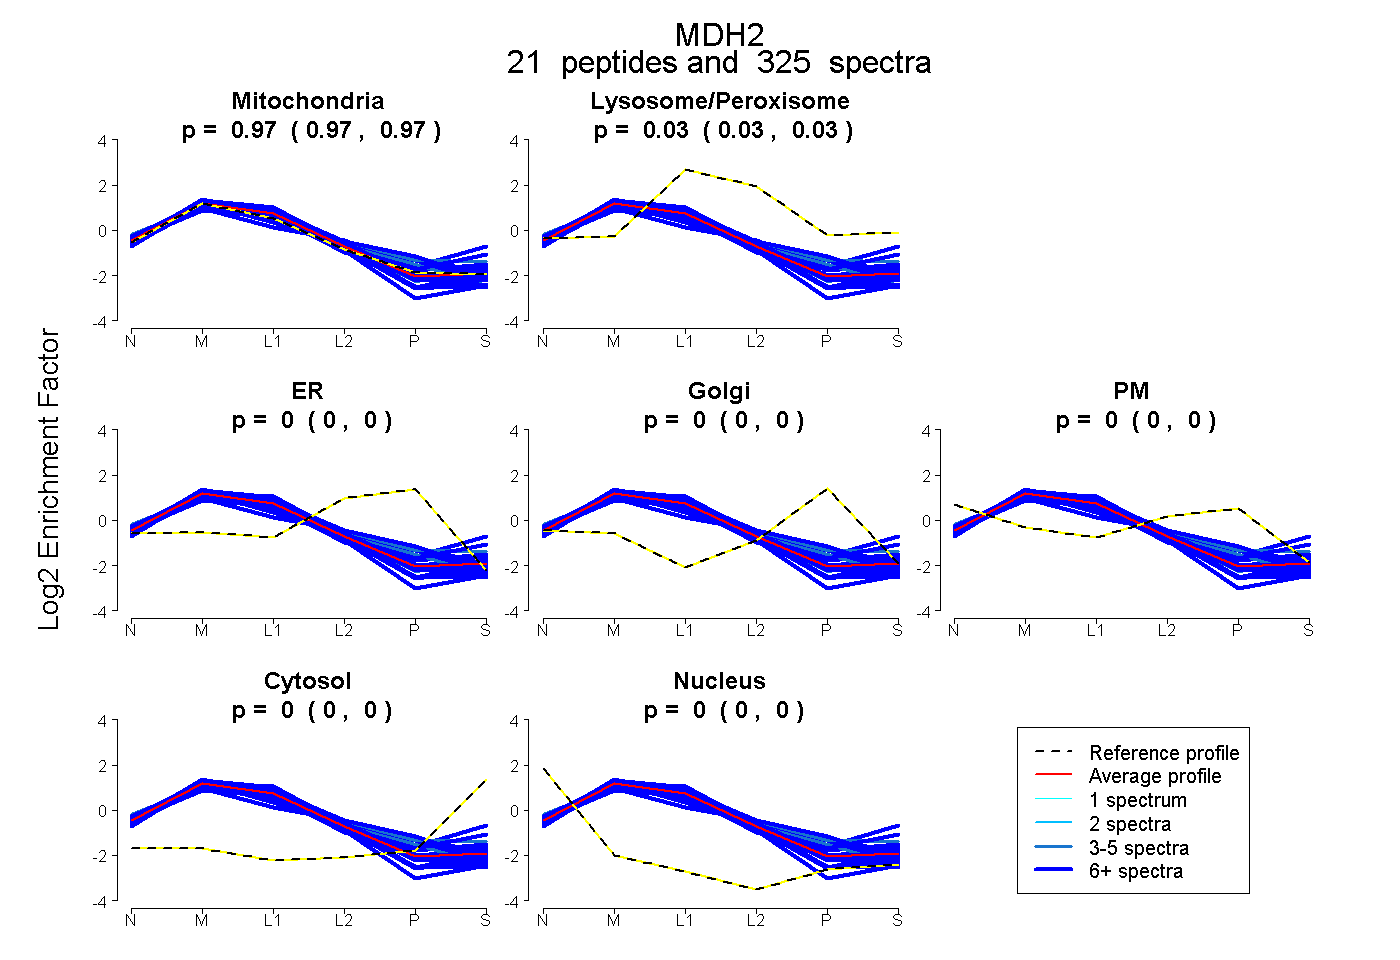
0.969 | 0.972
0.028 | 0.031
0.000 | 0.000
0.000 | 0.000
0.000 | 0.000
0.000 | 0.000
0.000 | 0.000
22peptides
spectra
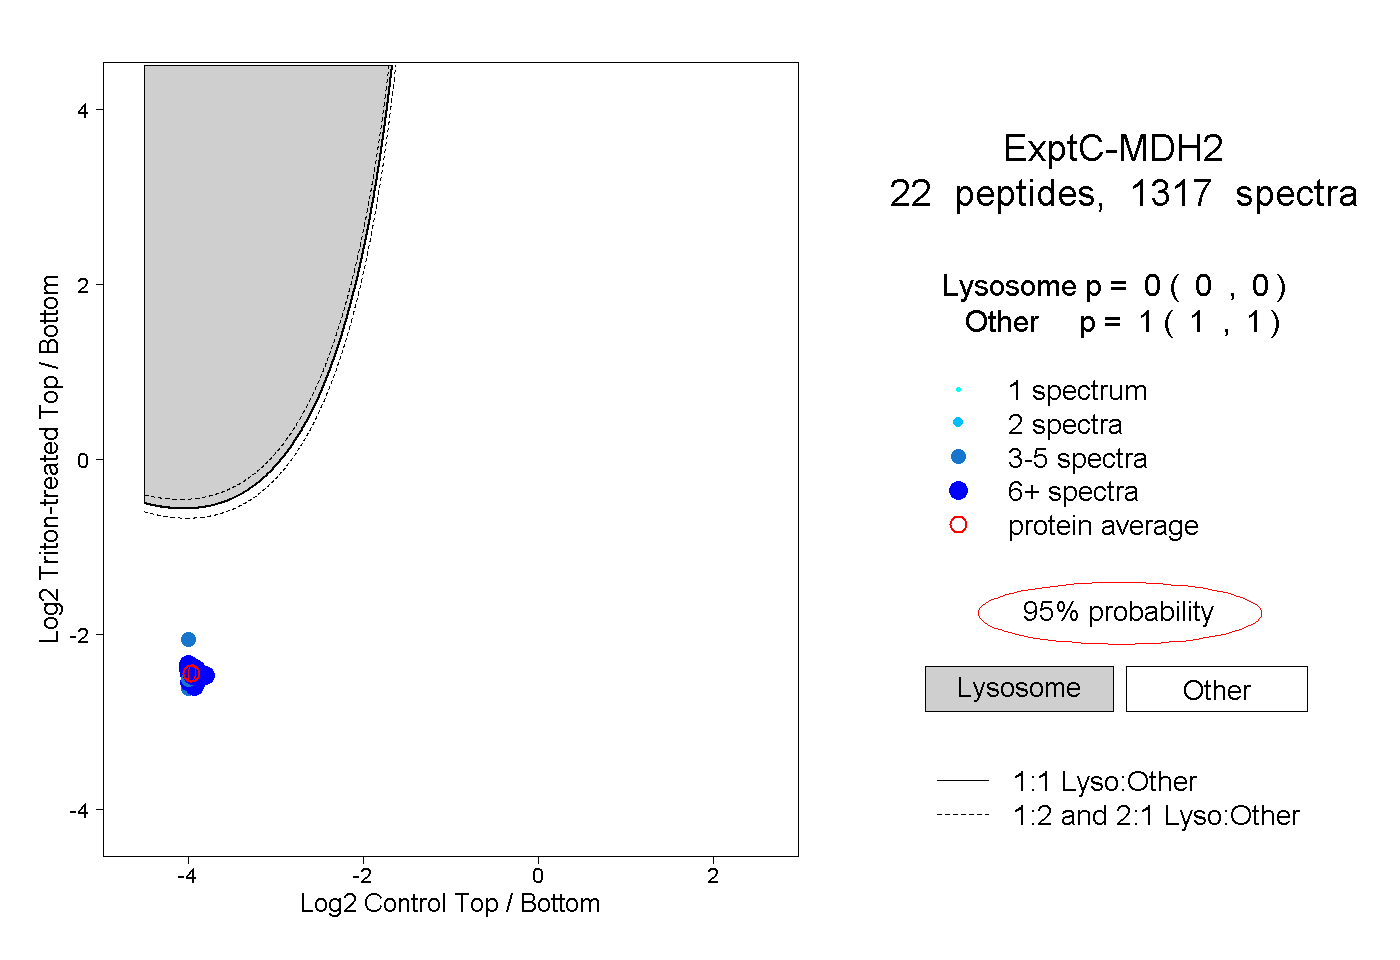
0.000 | 0.000
1.000 | 1.000
17peptides
spectra
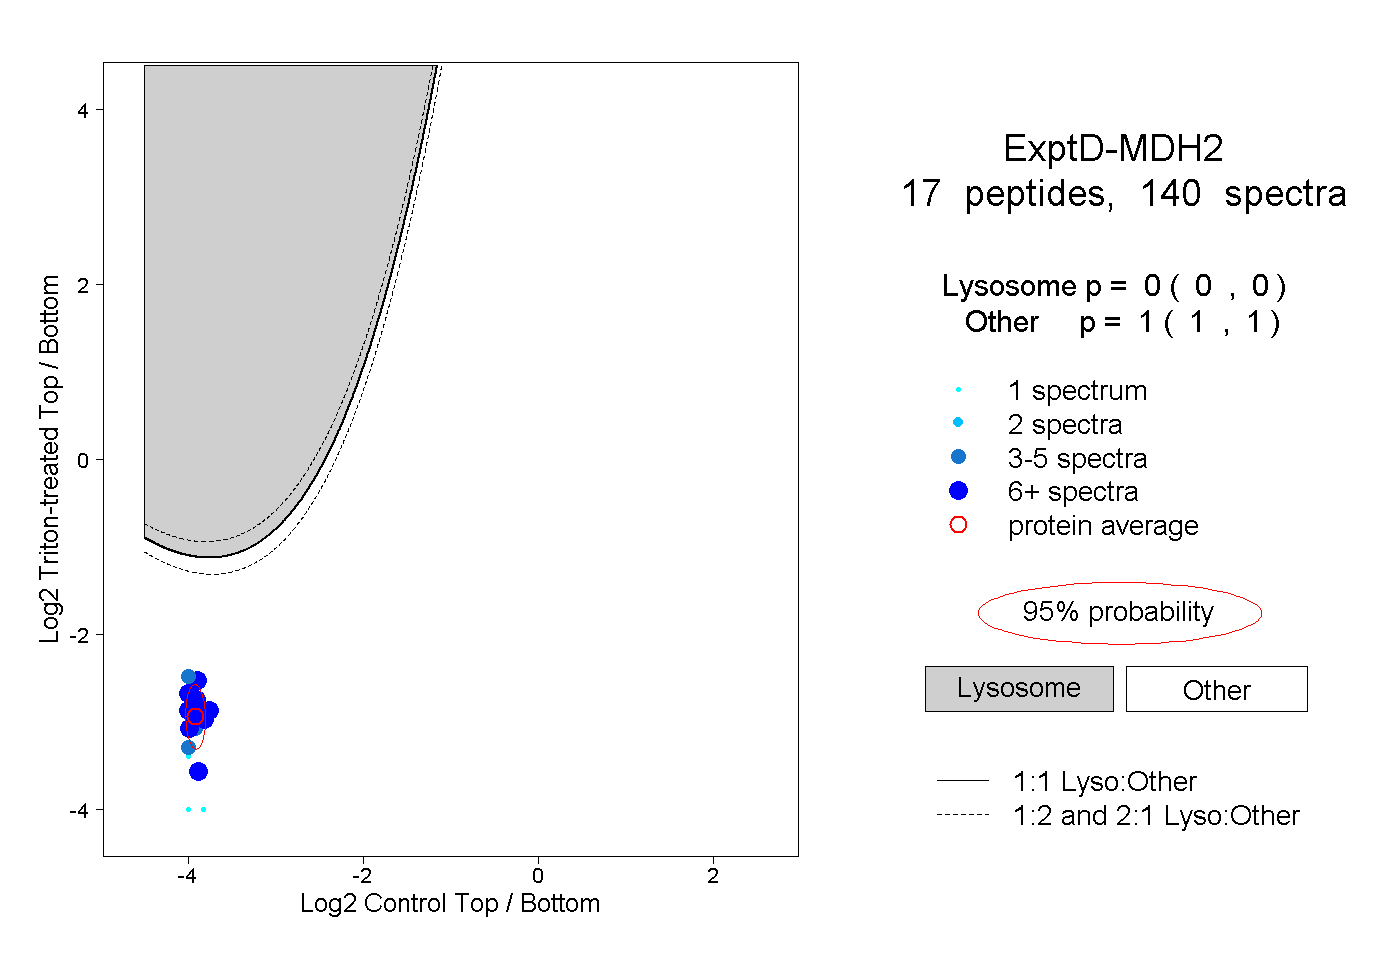
0.000 | 0.000
1.000 | 1.000