 4
4peptides
spectra
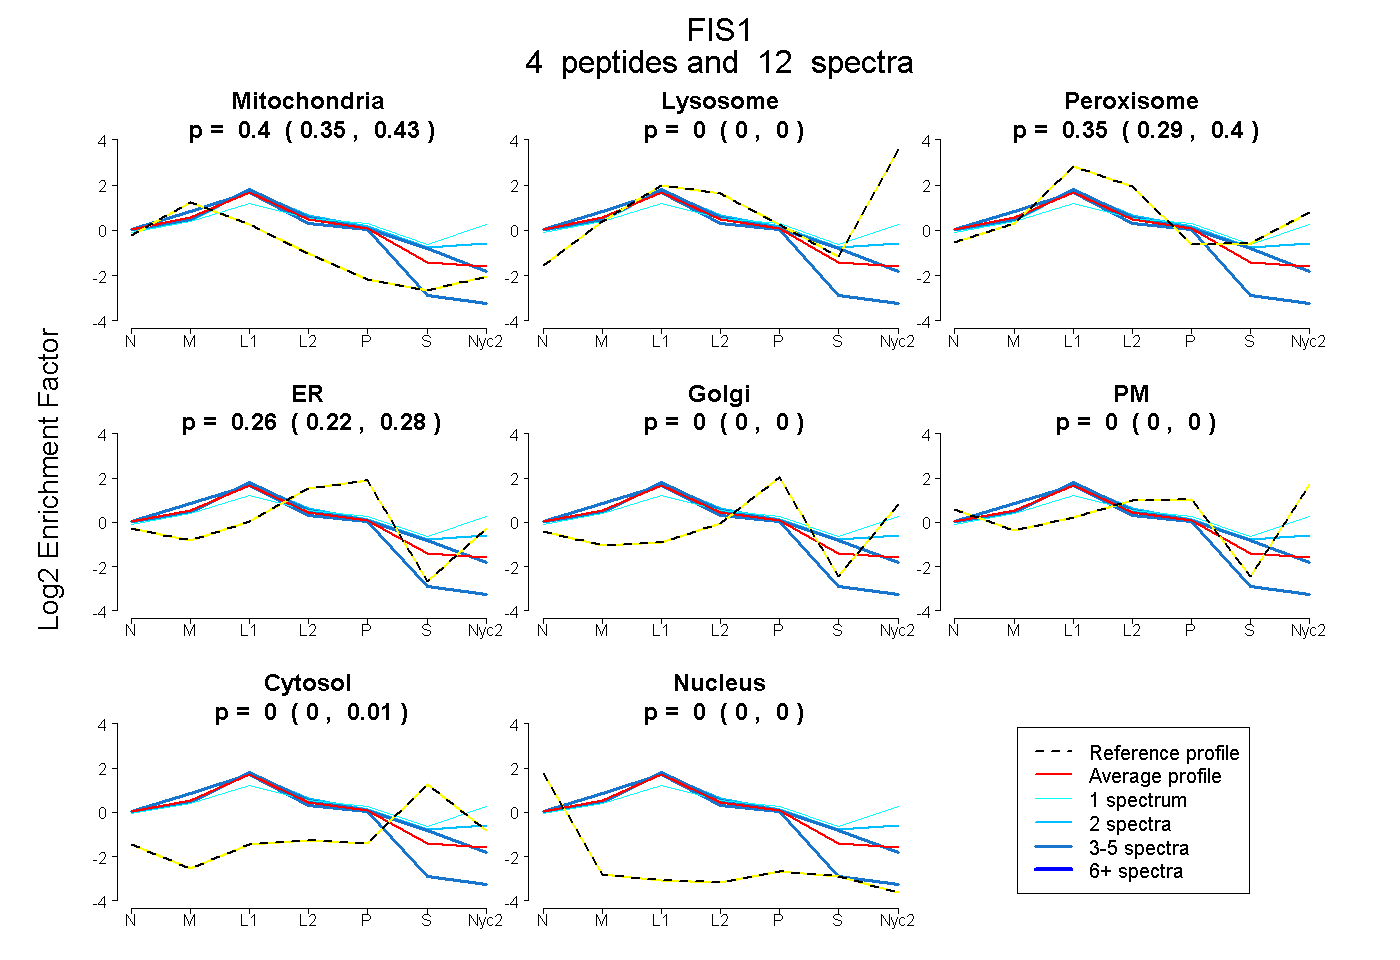
0.346 | 0.430
0.000 | 0.000
0.290 | 0.399
0.221 | 0.283
0.000 | 0.000
0.000 | 0.000
0.000 | 0.014
0.000 | 0.001
4peptides
spectra
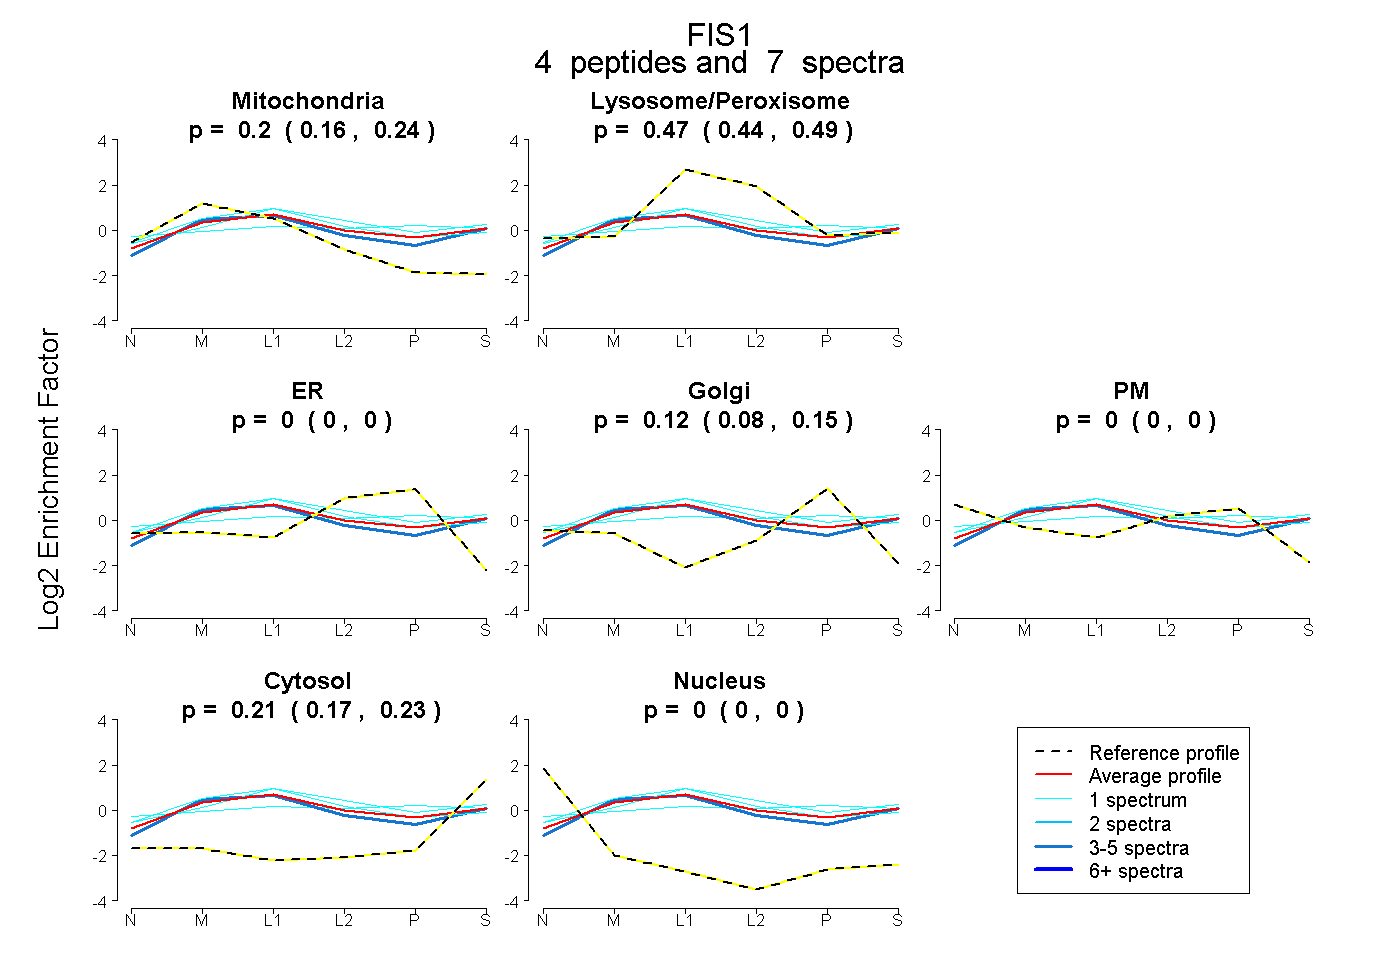
0.157 | 0.239
0.440 | 0.493
0.000 | 0.000
0.085 | 0.154
0.000 | 0.000
0.171 | 0.233
0.000 | 0.000
6peptides
spectra
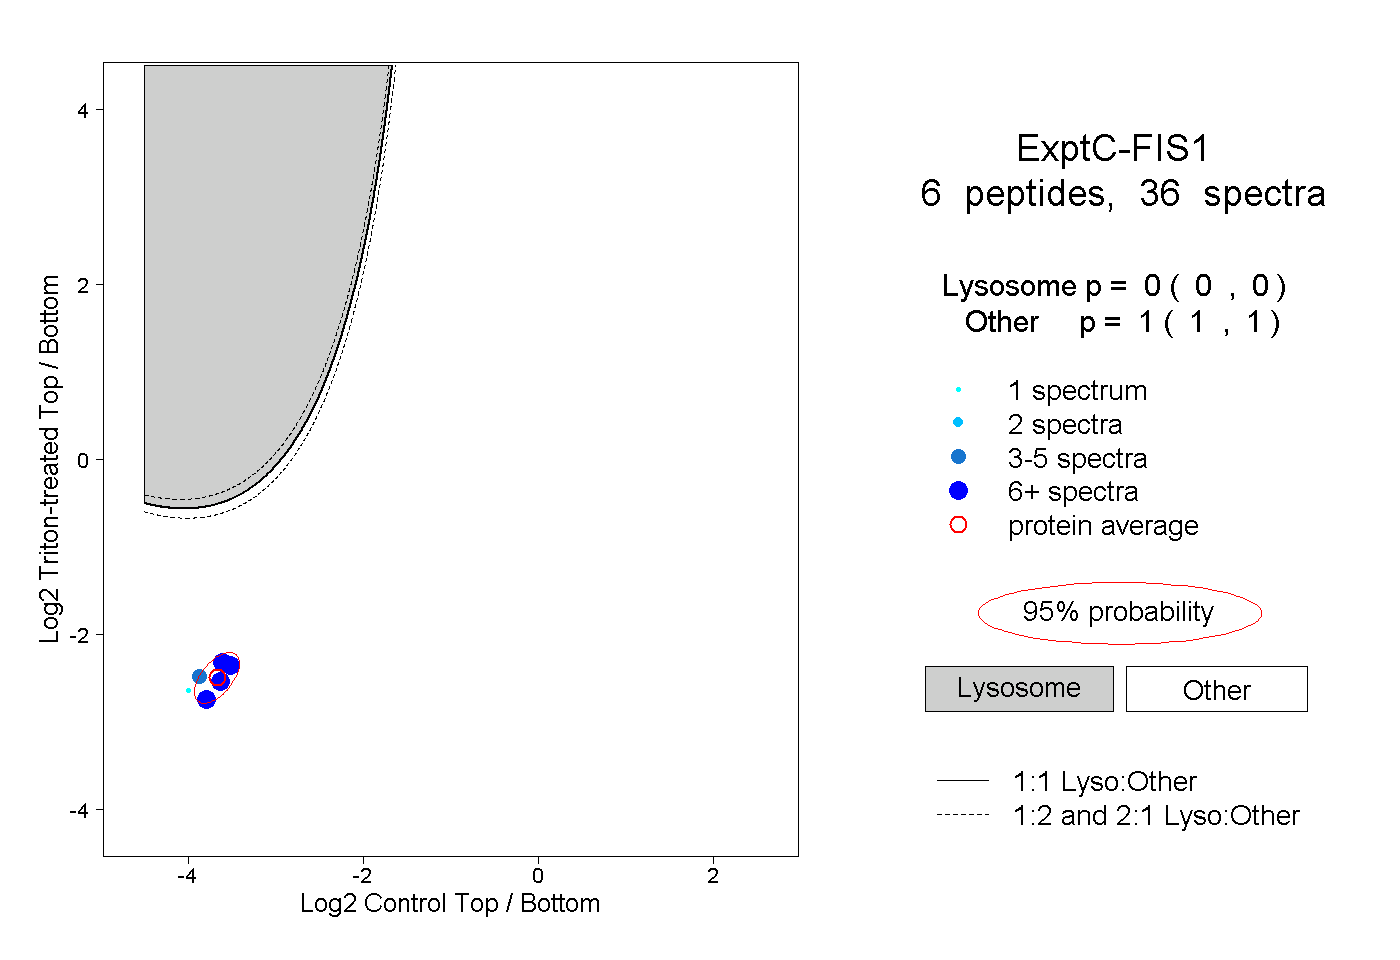
0.000 | 0.000
1.000 | 1.000
2peptides
spectra
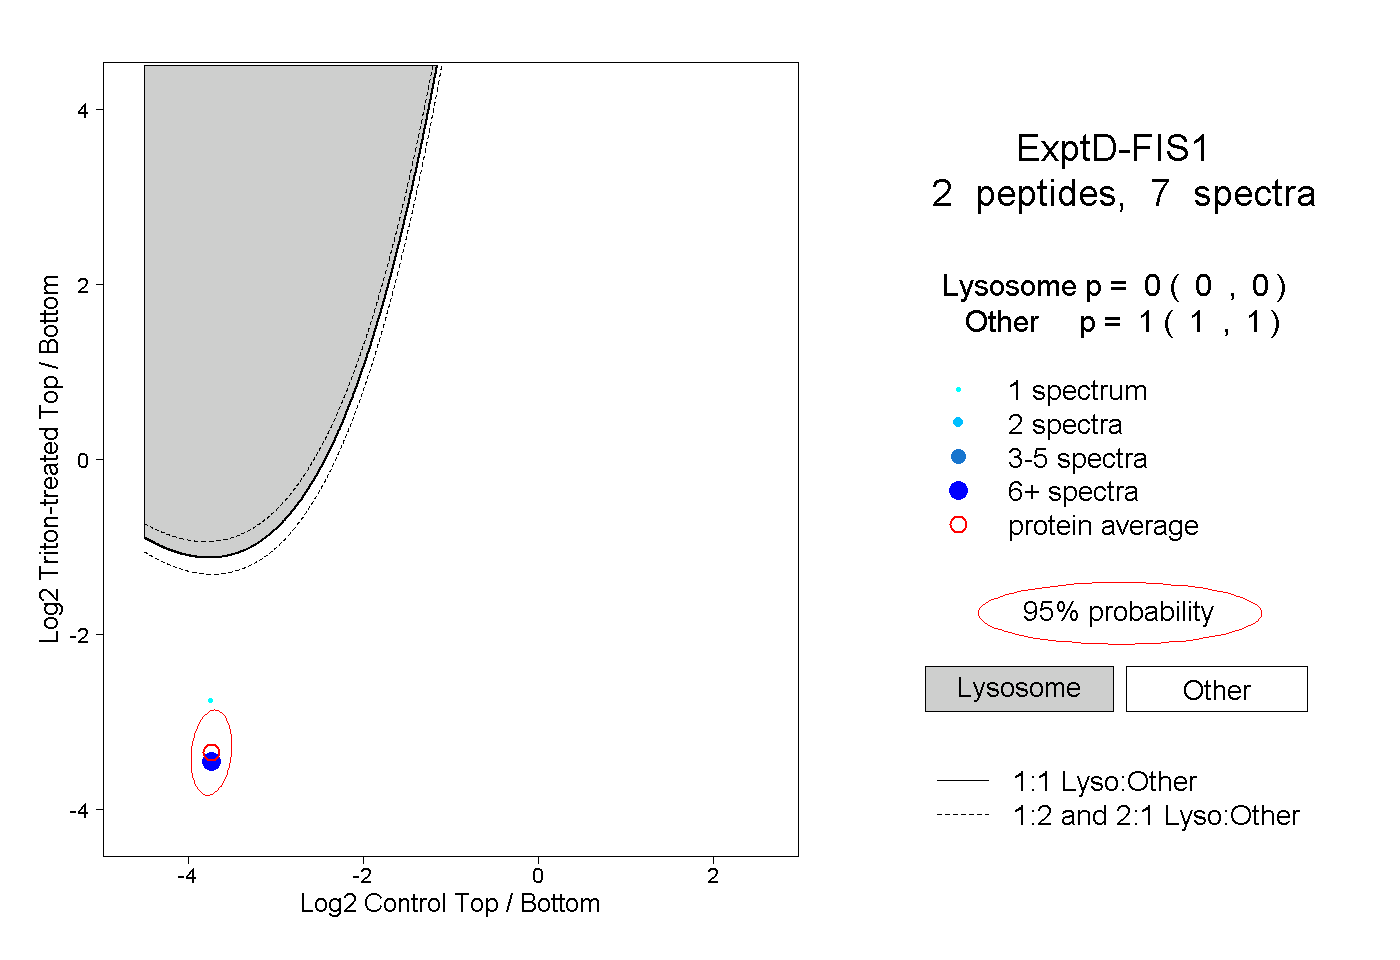
0.000 | 0.000
1.000 | 1.000