 14
14peptides
spectra
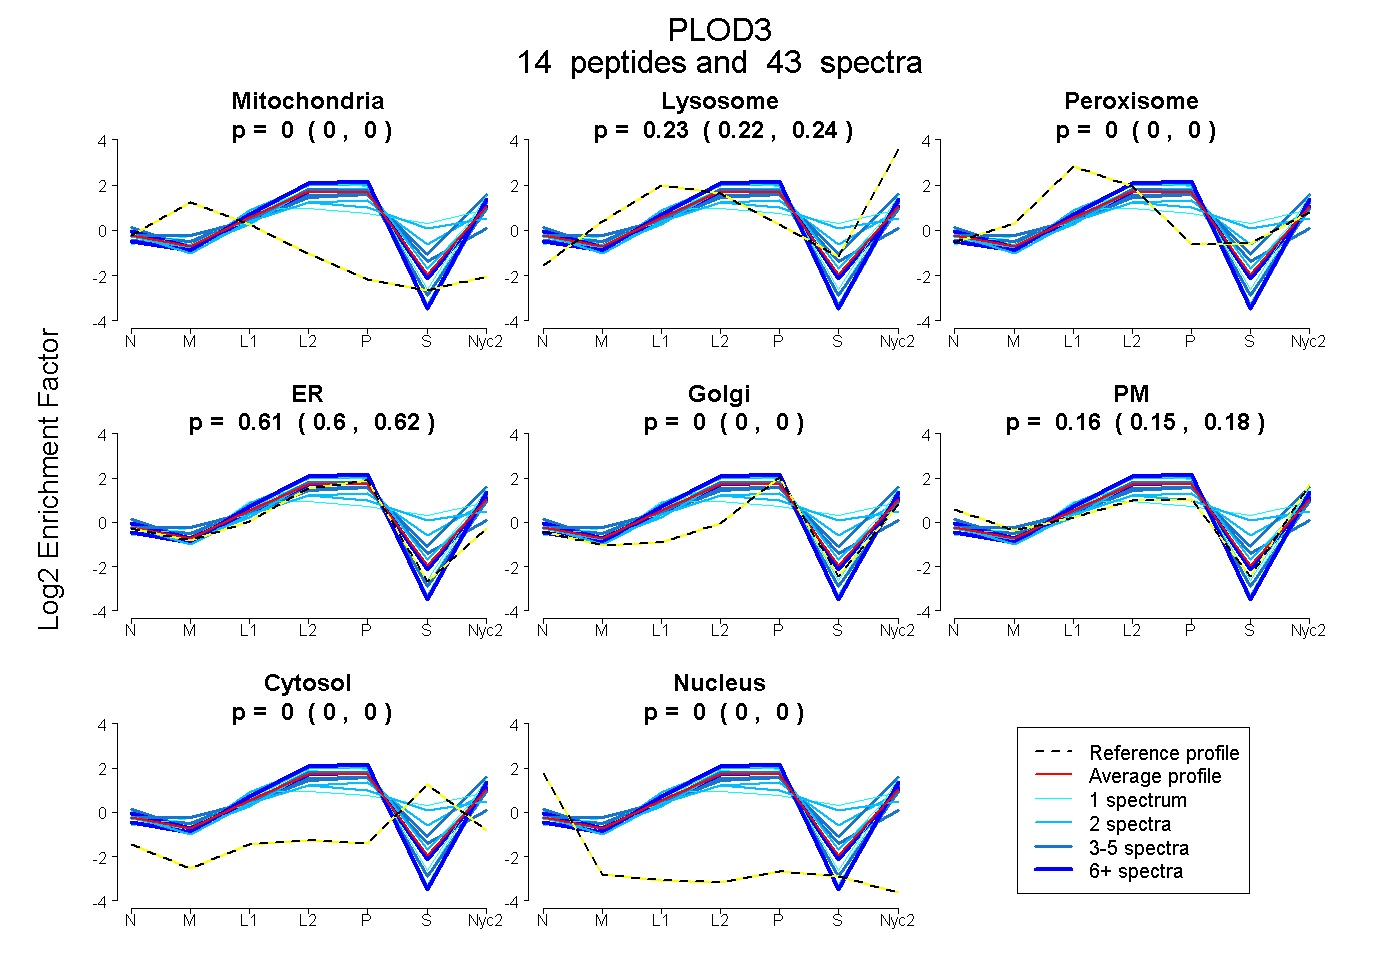
0.000 | 0.000
0.218 | 0.238
0.000 | 0.001
0.595 | 0.618
0.000 | 0.000
0.146 | 0.176
0.000 | 0.003
0.000 | 0.000
5peptides
spectra
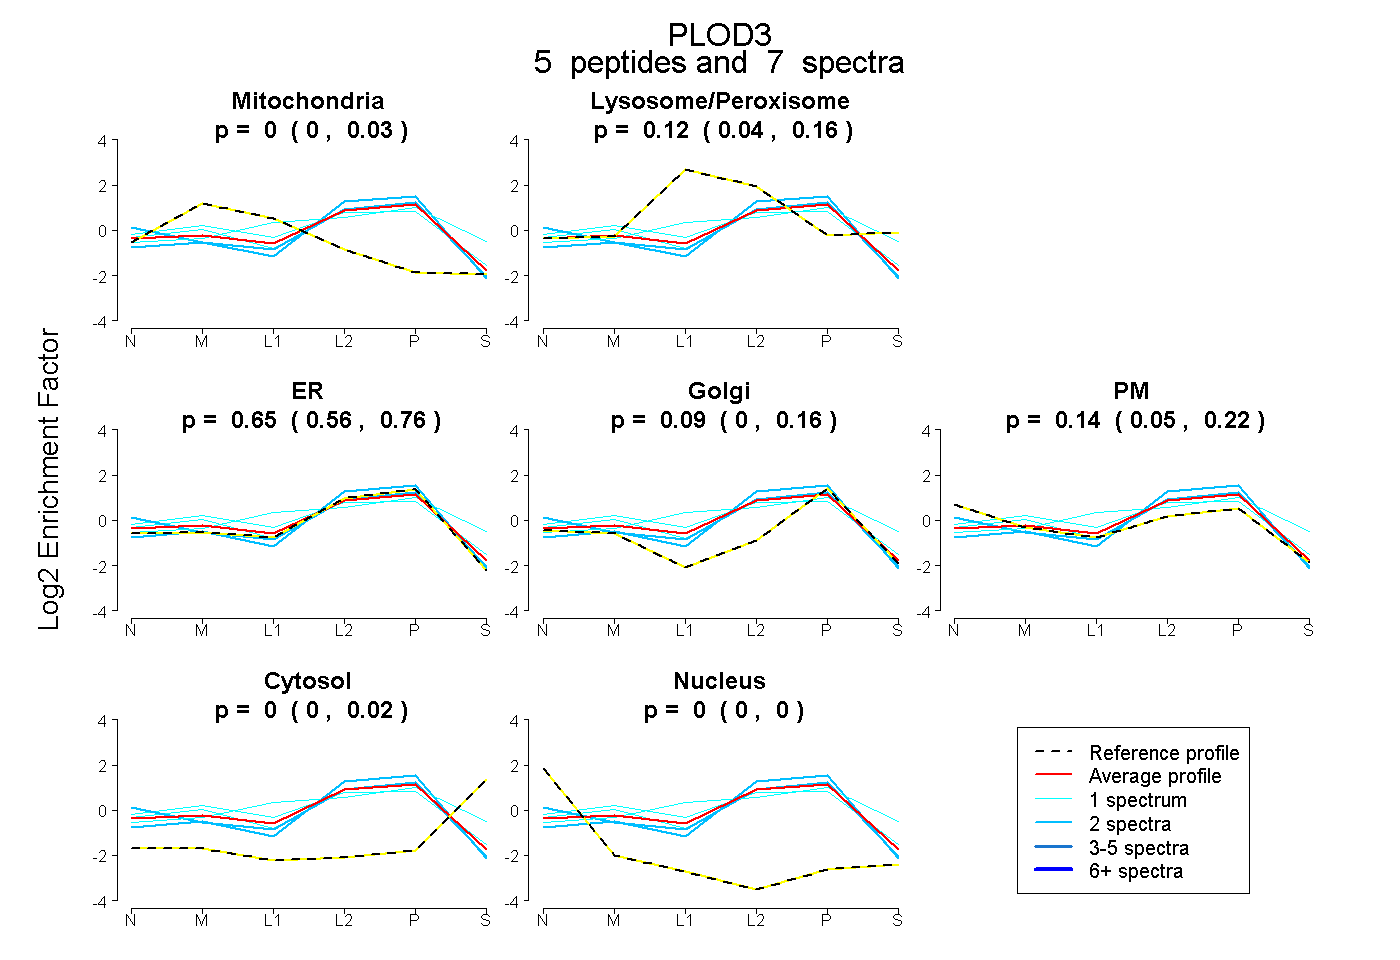
0.000 | 0.034
0.040 | 0.163
0.560 | 0.759
0.000 | 0.156
0.050 | 0.216
0.000 | 0.016
0.000 | 0.000
14peptides
spectra
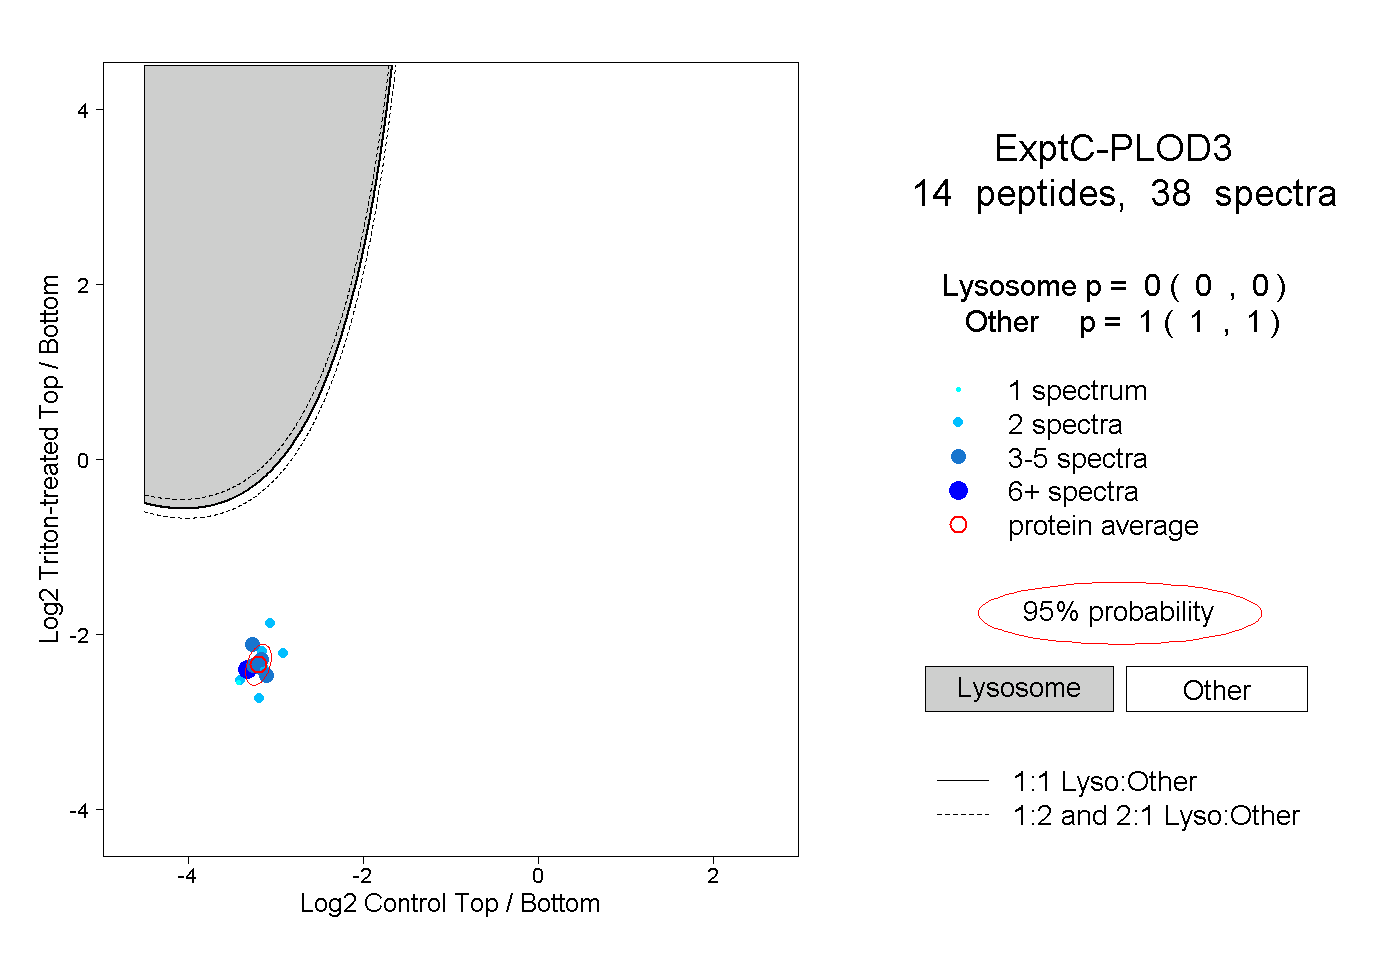
0.000 | 0.000
1.000 | 1.000
2peptides
spectra
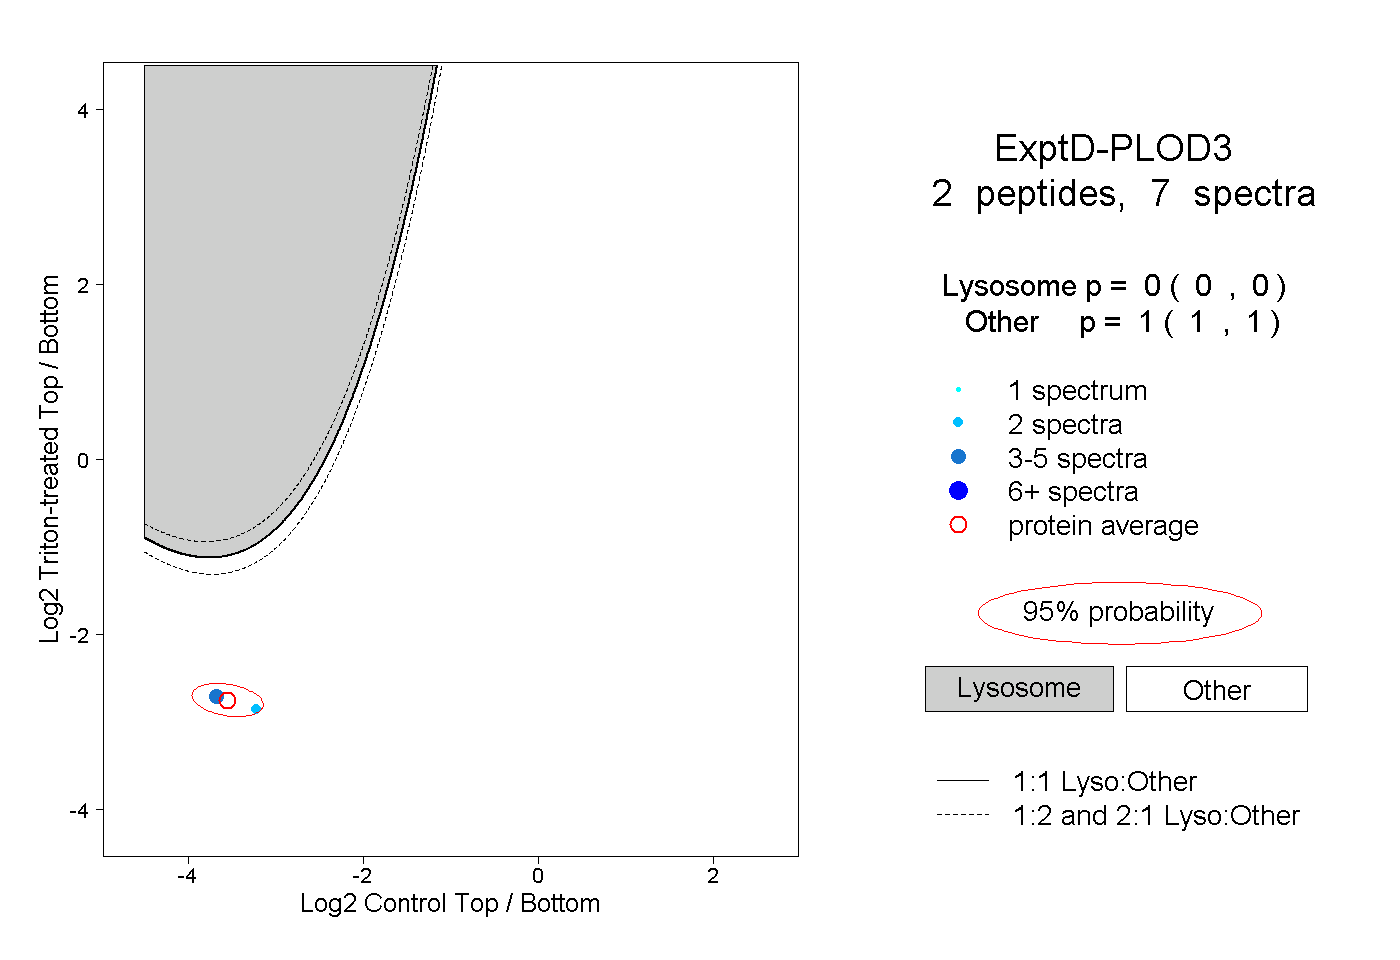
0.000 | 0.000
1.000 | 1.000