 1
1peptide
spectra
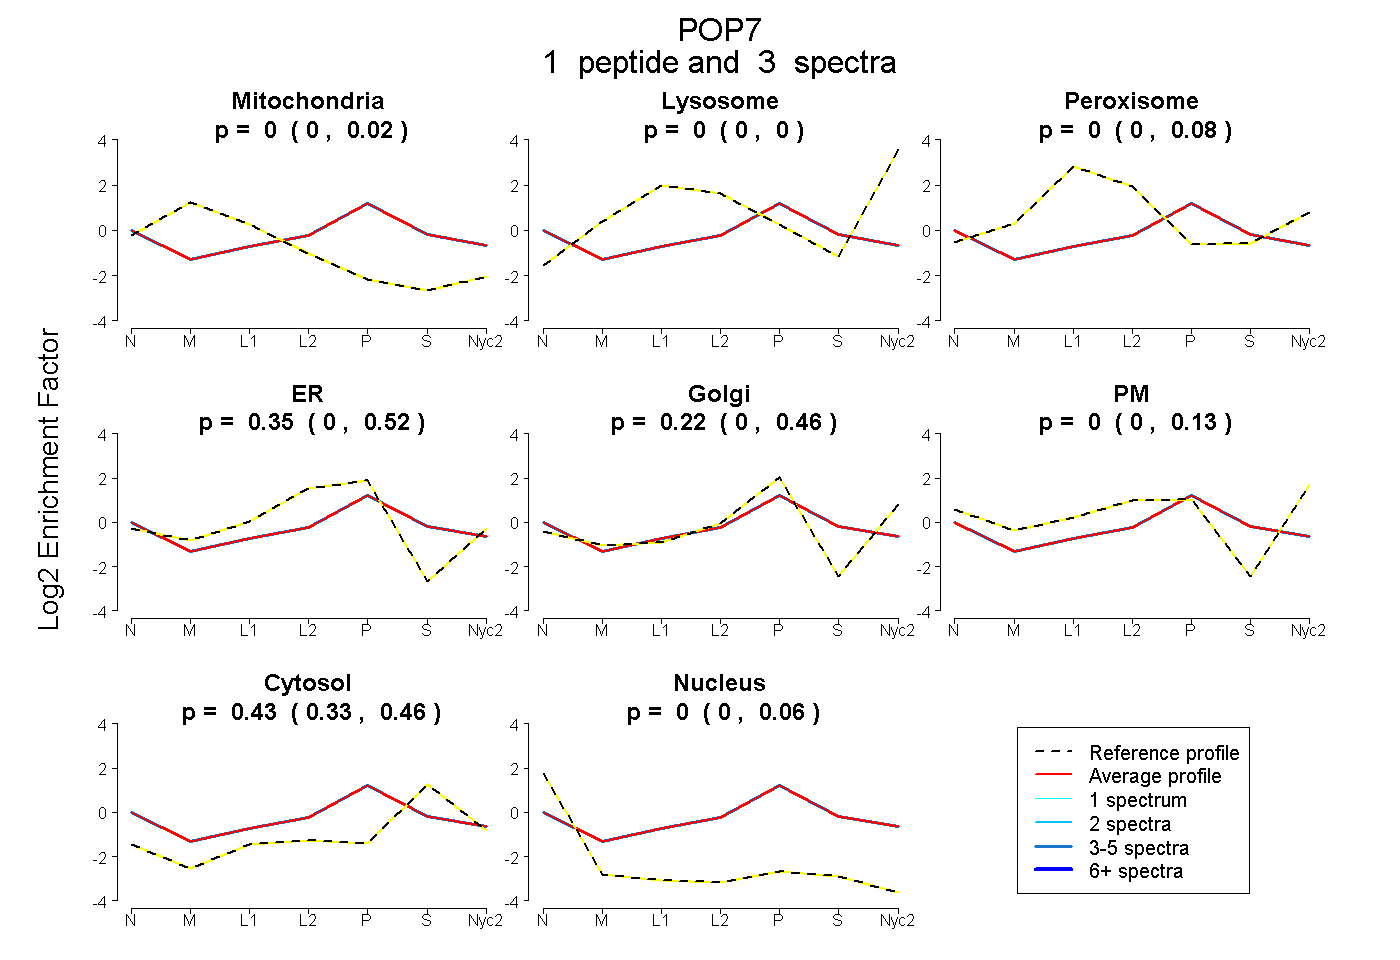
0.000 | 0.021
0.000 | 0.000
0.000 | 0.080
0.000 | 0.515
0.000 | 0.464
0.000 | 0.133
0.335 | 0.460
0.000 | 0.059
| Plot | Mito | Lyso | Perox | ER | Golgi | PM | Cytosol | Nucleus | |||||
| Expt A |
1 peptide |
3 spectra |
|
0.000 0.000 | 0.021 |
0.000 0.000 | 0.000 |
0.000 0.000 | 0.080 |
0.354 0.000 | 0.515 |
0.216 0.000 | 0.464 |
0.000 0.000 | 0.133 |
0.431 0.335 | 0.460 |
0.000 0.000 | 0.059 |
| 3 spectra, GAIEAELDPVEYTLR | 0.000 | 0.000 | 0.000 | 0.354 | 0.216 | 0.000 | 0.431 | 0.000 |
| Plot | Lyso | Other | |||||||||||
| Expt C |
1 peptide |
1 spectrum |
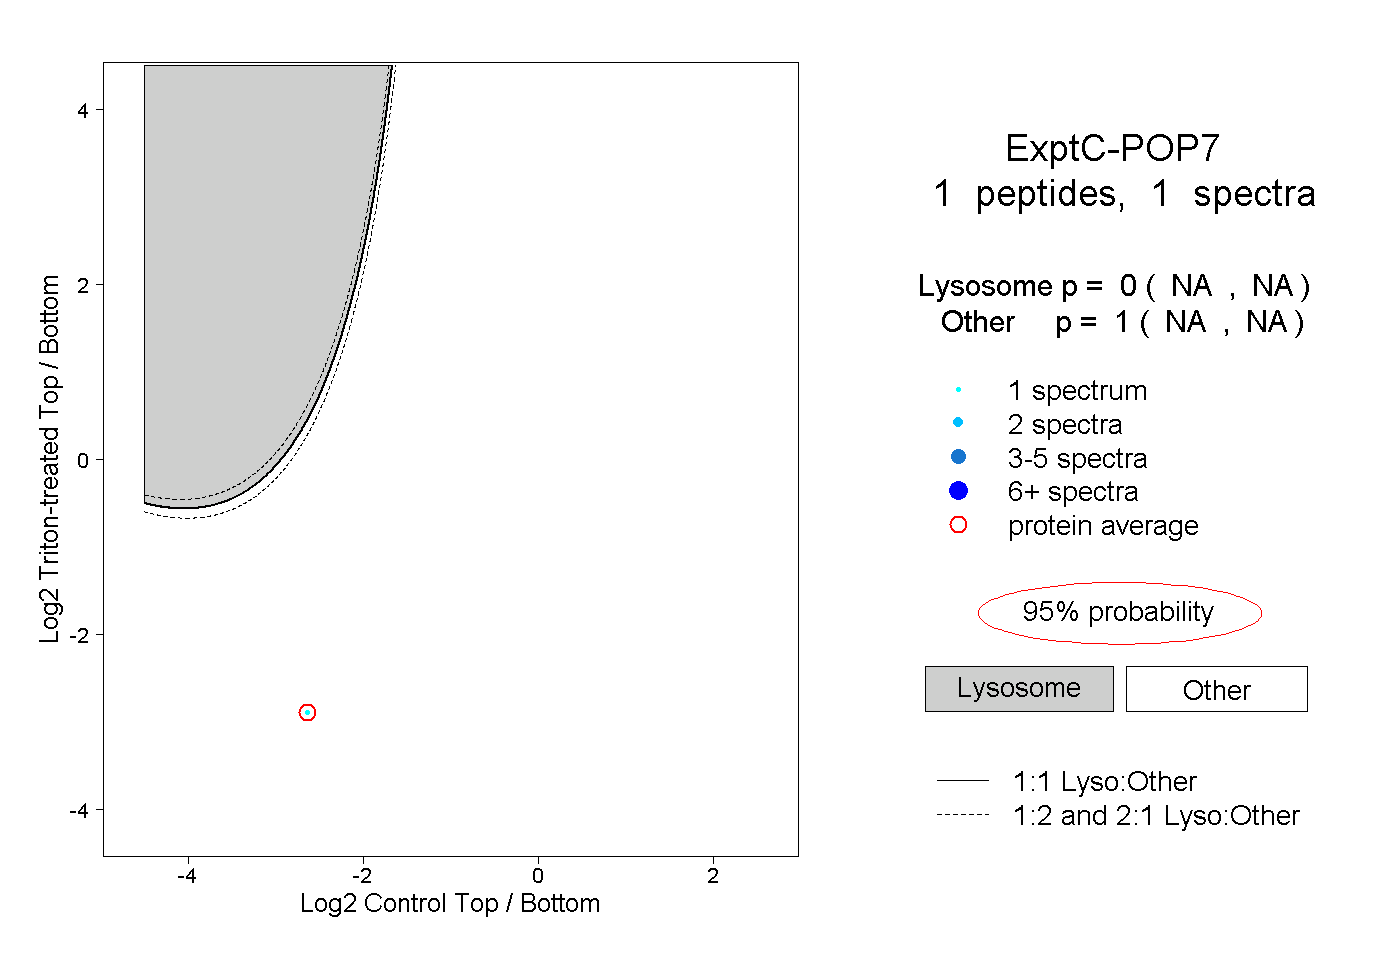 |
0.000 NA | NA |
1.000 NA | NA |