 4
4peptides
spectra
0.000 | 0.000
0.000 | 0.000
0.000 | 0.004
0.000 | 0.113
0.000 | 0.078
0.179 | 0.329
0.621 | 0.669
0.000 | 0.042
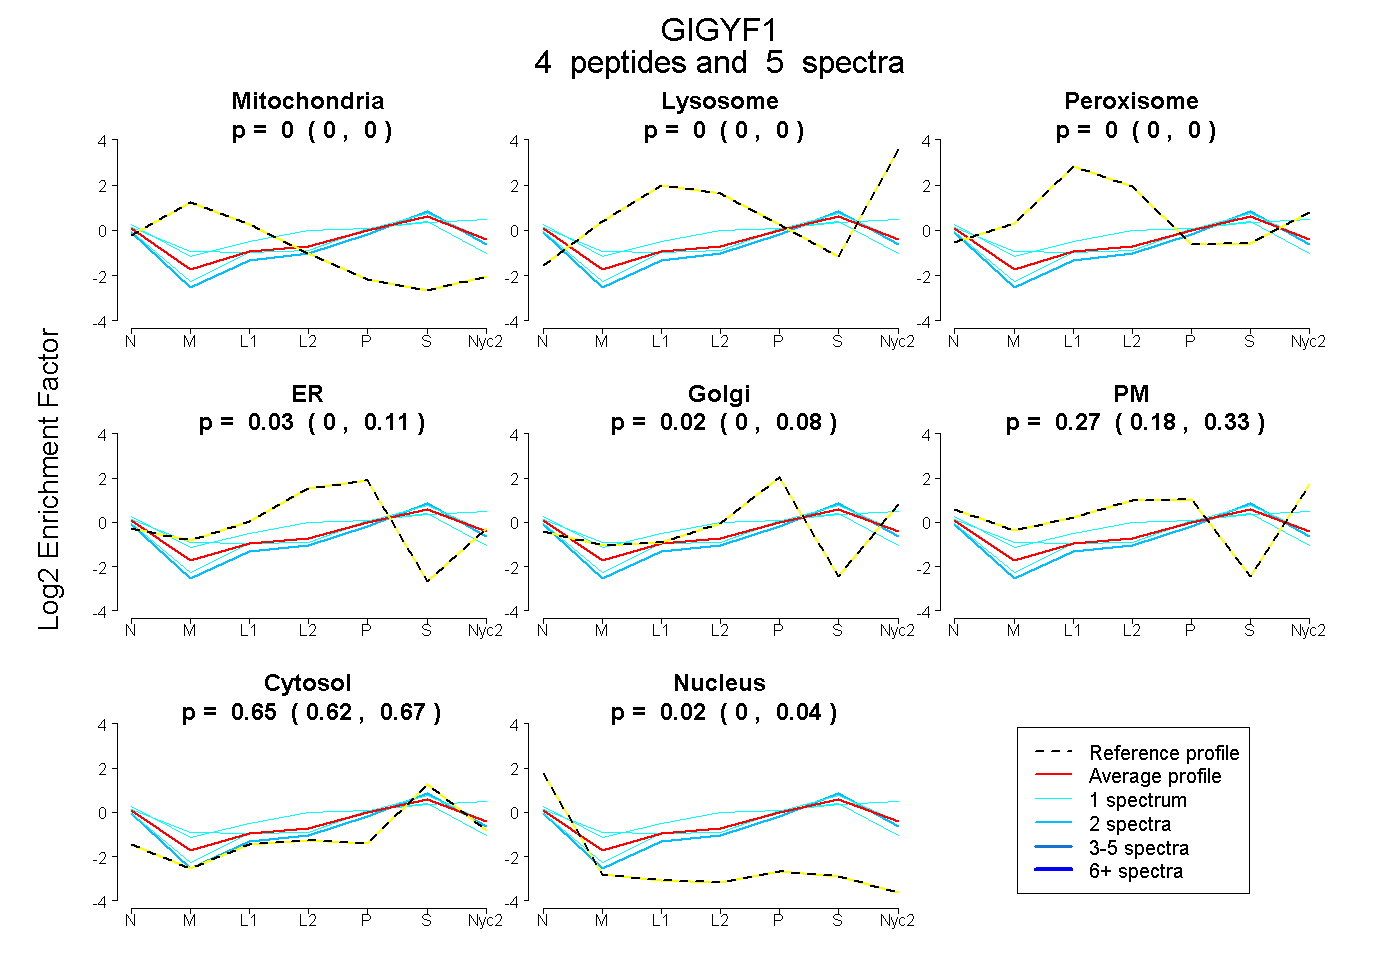
| Plot | Mito | Lyso | Perox | ER | Golgi | PM | Cytosol | Nucleus | |||||
| Expt A |
4 peptides |
5 spectra |
|
0.000 0.000 | 0.000 |
0.000 0.000 | 0.000 |
0.000 0.000 | 0.004 |
0.032 0.000 | 0.113 |
0.024 0.000 | 0.078 |
0.273 0.179 | 0.329 |
0.649 0.621 | 0.669 |
0.023 0.000 | 0.042 |
| 1 spectrum, EVESPYDVHDYIR | 0.119 | 0.000 | 0.000 | 0.117 | 0.097 | 0.086 | 0.552 | 0.028 | ||
| 2 spectra, QEEEELFR | 0.000 | 0.000 | 0.000 | 0.000 | 0.151 | 0.069 | 0.732 | 0.048 | ||
| 1 spectrum, SIEEGDGAFGR | 0.000 | 0.000 | 0.000 | 0.000 | 0.126 | 0.163 | 0.701 | 0.010 | ||
| 1 spectrum, SDSENWR | 0.000 | 0.000 | 0.075 | 0.000 | 0.000 | 0.433 | 0.492 | 0.000 |