 2
2peptides
spectra
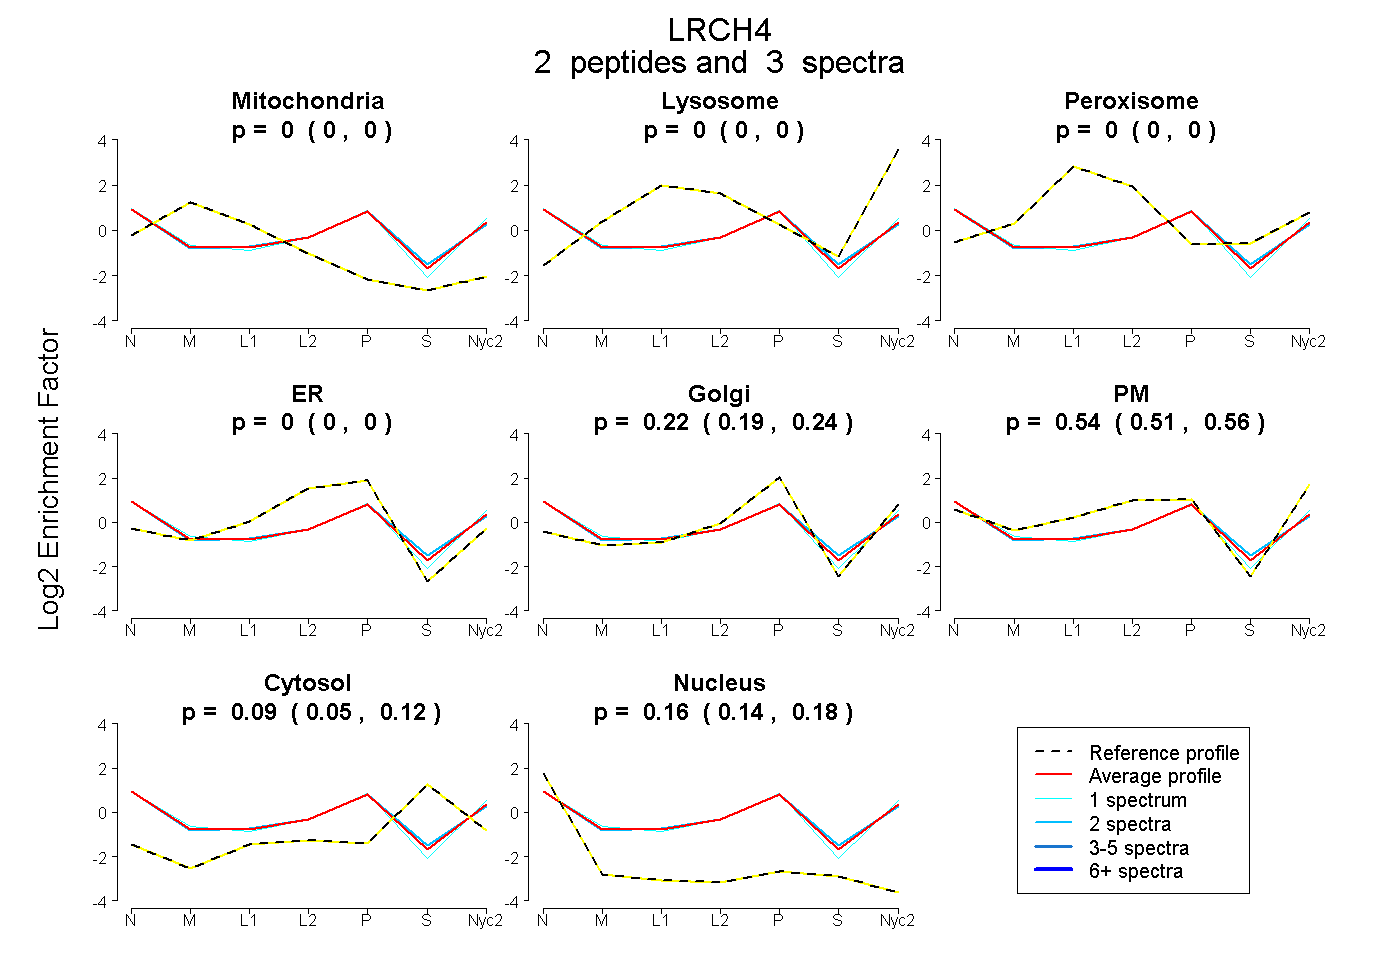
0.000 | 0.000
0.000 | 0.000
0.000 | 0.000
0.000 | 0.000
0.189 | 0.241
0.514 | 0.558
0.048 | 0.119
0.140 | 0.176
| Plot | Mito | Lyso | Perox | ER | Golgi | PM | Cytosol | Nucleus | |||||
| Expt A |
2 peptides |
3 spectra |
|
0.000 0.000 | 0.000 |
0.000 0.000 | 0.000 |
0.000 0.000 | 0.000 |
0.000 0.000 | 0.000 |
0.217 0.189 | 0.241 |
0.537 0.514 | 0.558 |
0.086 0.048 | 0.119 |
0.160 0.140 | 0.176 |
| 1 spectrum, NQLSTLPDELGDLPLVR | 0.000 | 0.000 | 0.000 | 0.000 | 0.262 | 0.547 | 0.009 | 0.182 | ||
| 2 spectra, SYDLSDITQADLSR | 0.000 | 0.000 | 0.000 | 0.000 | 0.194 | 0.532 | 0.125 | 0.149 |
| Plot | Lyso | Other | |||||||||||
| Expt C |
1 peptide |
2 spectra |
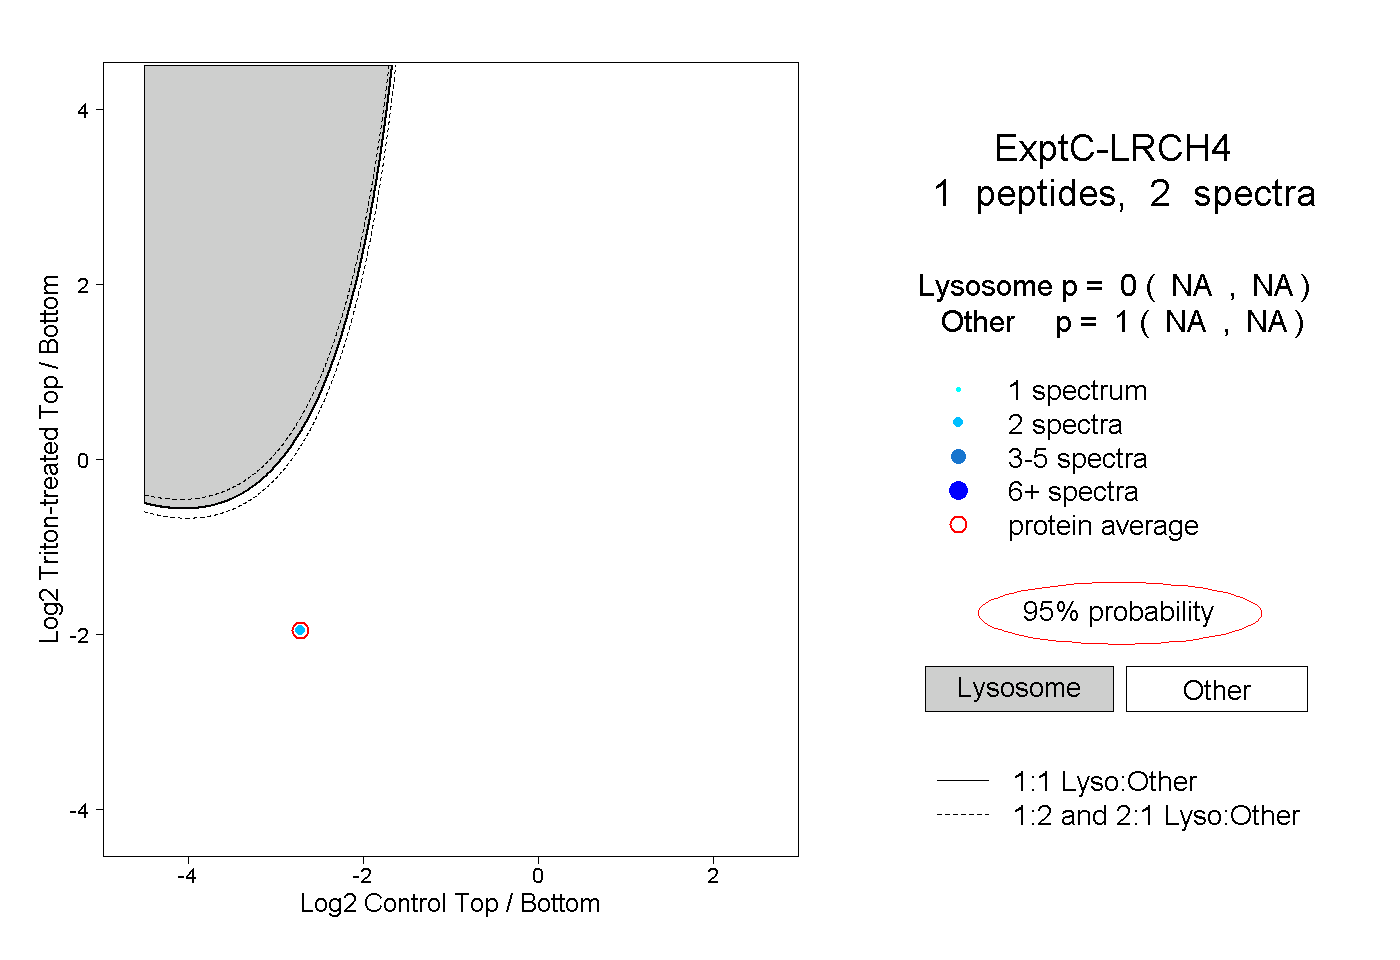 |
0.000 NA | NA |
1.000 NA | NA |