 3
3peptides
spectra
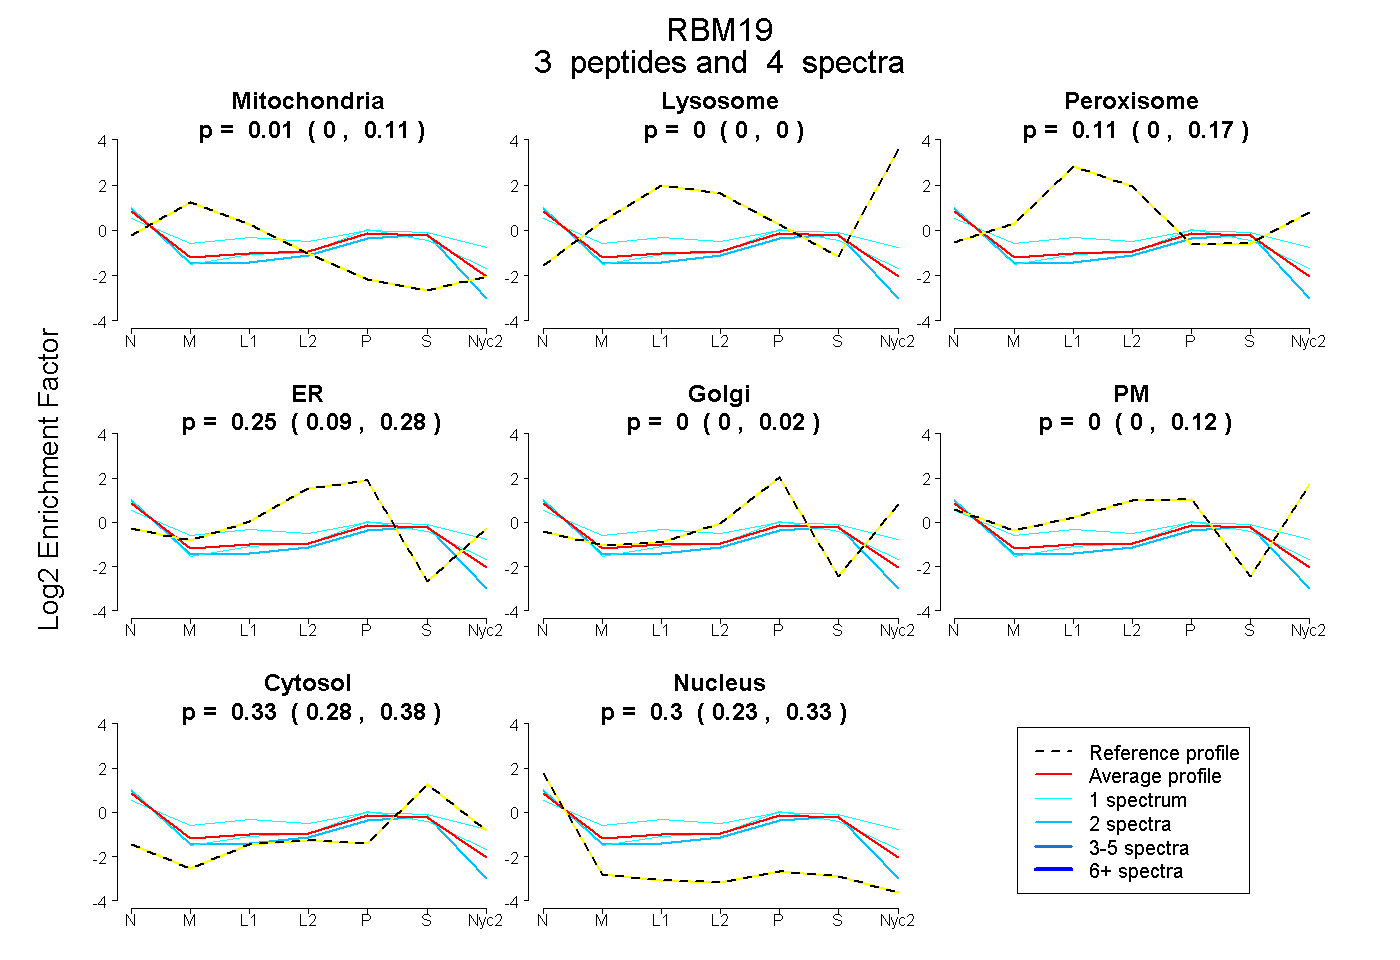
0.000 | 0.106
0.000 | 0.000
0.000 | 0.171
0.089 | 0.283
0.000 | 0.019
0.000 | 0.118
0.284 | 0.376
0.231 | 0.331
| Plot | Mito | Lyso | Perox | ER | Golgi | PM | Cytosol | Nucleus | |||||
| Expt A |
3 peptides |
4 spectra |
|
0.013 0.000 | 0.106 |
0.000 0.000 | 0.000 |
0.114 0.000 | 0.171 |
0.245 0.089 | 0.283 |
0.000 0.000 | 0.019 |
0.000 0.000 | 0.118 |
0.328 0.284 | 0.376 |
0.300 0.231 | 0.331 |
| 2 spectra, SEEEAQAALNHFHR | 0.033 | 0.000 | 0.027 | 0.220 | 0.000 | 0.000 | 0.345 | 0.374 | ||
| 1 spectrum, AEAEQETVLNPEGEK | 0.073 | 0.000 | 0.201 | 0.044 | 0.068 | 0.163 | 0.332 | 0.120 | ||
| 1 spectrum, SFIDTSR | 0.000 | 0.000 | 0.054 | 0.276 | 0.000 | 0.053 | 0.327 | 0.291 |