 2
2peptides
spectra
0.000 | 0.000
0.880 | 0.933
0.000 | 0.048
0.000 | 0.000
0.000 | 0.000
0.000 | 0.000
0.037 | 0.112
0.000 | 0.000
6peptides
spectra
0.000 | 0.014
0.985 | 1.000
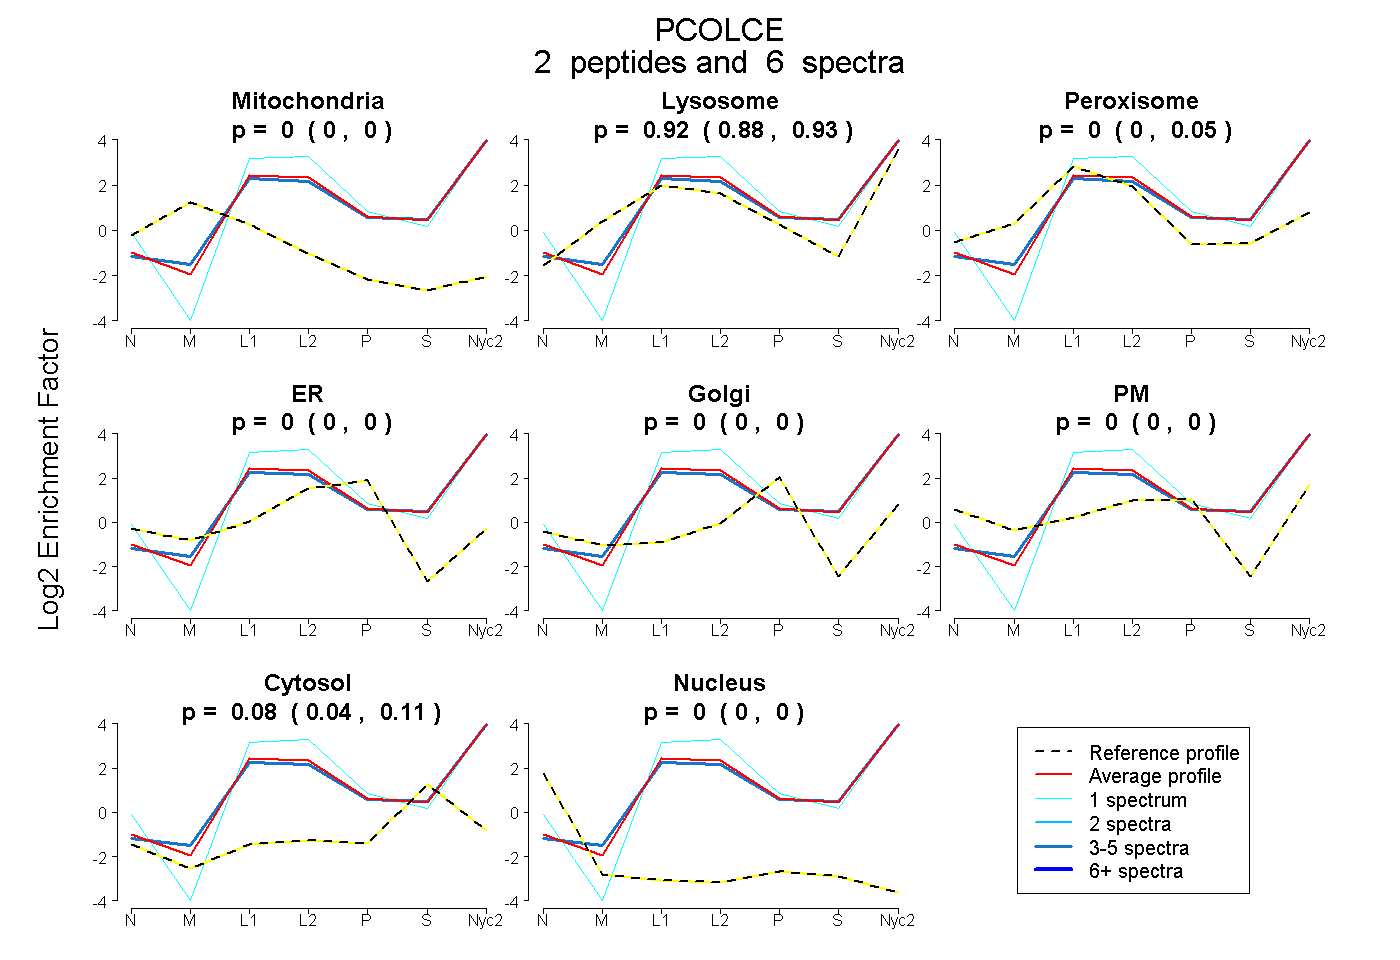
| Plot | Mito | Lyso | Perox | ER | Golgi | PM | Cytosol | Nucleus | |||||
| Expt A |
2 peptides |
6 spectra |
|
0.000 0.000 | 0.000 |
0.918 0.880 | 0.933 |
0.000 0.000 | 0.048 |
0.000 0.000 | 0.000 |
0.000 0.000 | 0.000 |
0.000 0.000 | 0.000 |
0.082 0.037 | 0.112 |
0.000 0.000 | 0.000 |
||
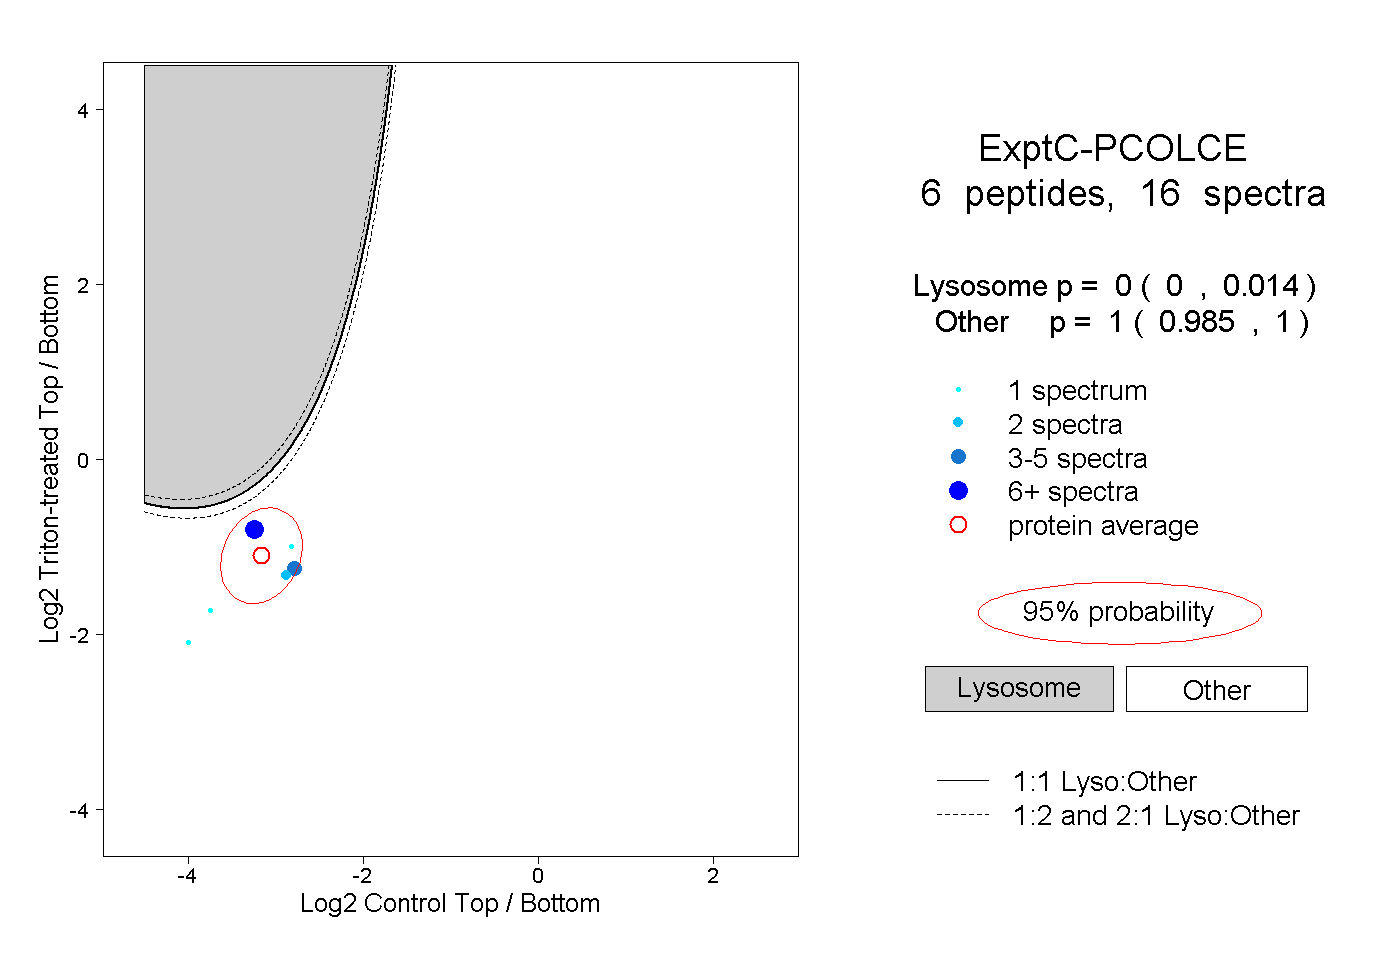
| Plot | Lyso | Other | |||||||||||
| Expt C |
6 peptides |
16 spectra |
|
0.000 0.000 | 0.014 |
1.000 0.985 | 1.000 |
| 2 spectra, VKPPSKPK | 0.000 | 1.000 | ||||||||
| 8 spectra, FCGTFRPAPVVAPGNQVTLR | 0.005 | 0.995 | ||||||||
| 1 spectrum, TGTGPK | 0.000 | 1.000 | ||||||||
| 3 spectra, FDVEPDTYCR | 0.000 | 1.000 | ||||||||
| 1 spectrum, ATSGTEHQFCGGR | 0.000 | 1.000 | ||||||||
| 1 spectrum, FYVPCK | 0.000 | 1.000 |