 14
14peptides
spectra
0.000 | 0.000
1.000 | 1.000
0.000 | 0.000
0.000 | 0.000
0.000 | 0.000
0.000 | 0.000
0.000 | 0.000
0.000 | 0.000
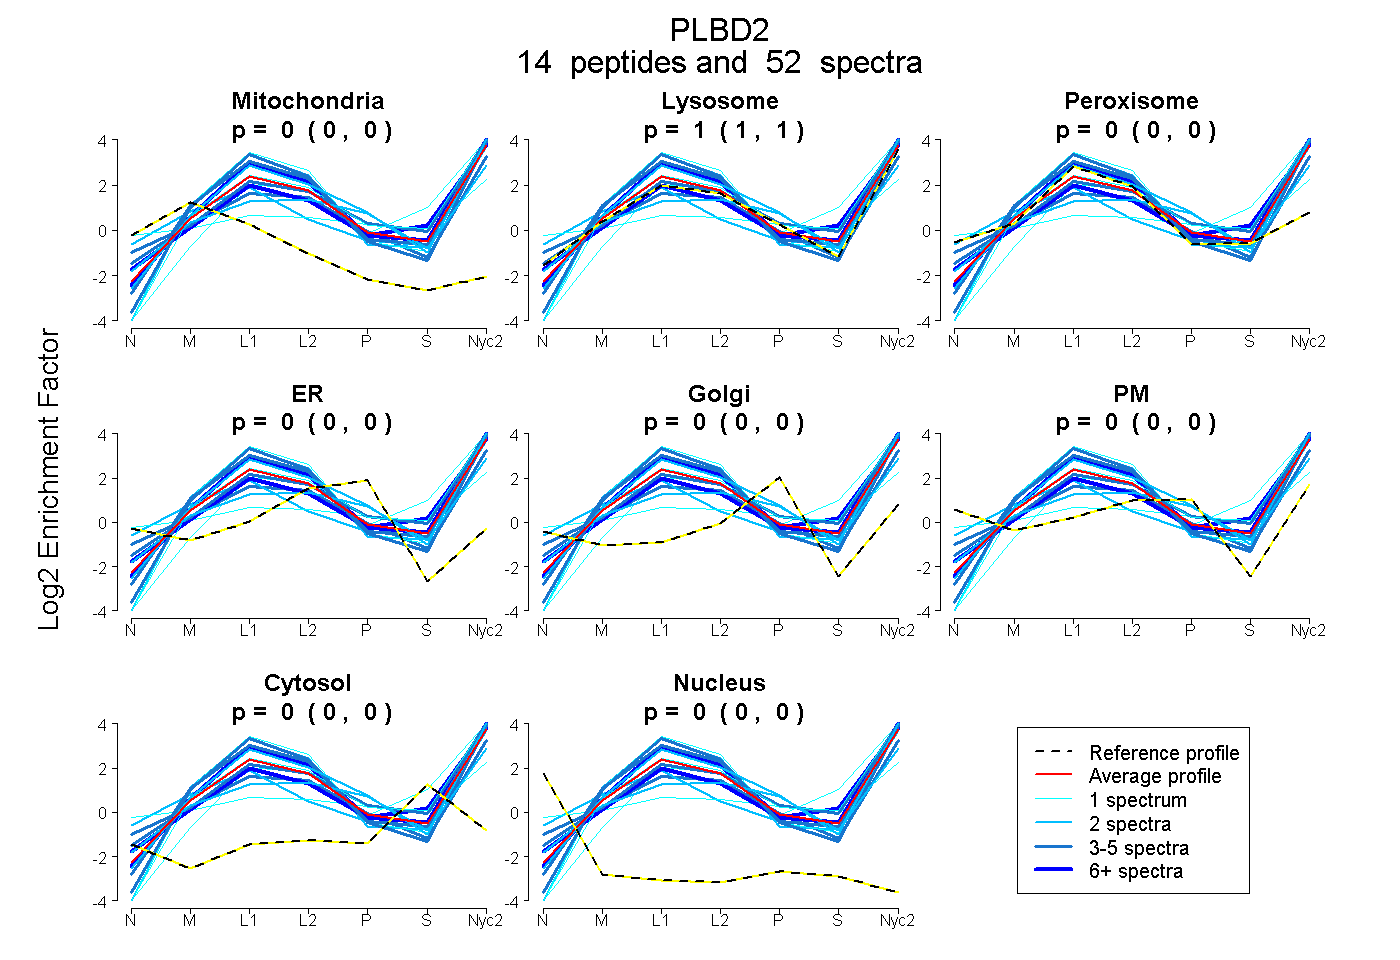
| Plot | Mito | Lyso | Perox | ER | Golgi | PM | Cytosol | Nucleus | |||||
| Expt A |
14 peptides |
52 spectra |
|
0.000 0.000 | 0.000 |
1.000 1.000 | 1.000 |
0.000 0.000 | 0.000 |
0.000 0.000 | 0.000 |
0.000 0.000 | 0.000 |
0.000 0.000 | 0.000 |
0.000 0.000 | 0.000 |
0.000 0.000 | 0.000 |
| 17 spectra, LTFPTGR | 0.000 | 0.920 | 0.000 | 0.000 | 0.000 | 0.000 | 0.080 | 0.000 | ||
| 3 spectra, SFLEANLEWMQR | 0.000 | 1.000 | 0.000 | 0.000 | 0.000 | 0.000 | 0.000 | 0.000 | ||
| 1 spectrum, NPALWK | 0.000 | 1.000 | 0.000 | 0.000 | 0.000 | 0.000 | 0.000 | 0.000 | ||
| 4 spectra, DQSLVEDVDTMVR | 0.009 | 0.935 | 0.000 | 0.000 | 0.000 | 0.000 | 0.023 | 0.033 | ||
| 4 spectra, SLLLDAASGQLR | 0.000 | 1.000 | 0.000 | 0.000 | 0.000 | 0.000 | 0.000 | 0.000 | ||
| 1 spectrum, LTLLQLK | 0.000 | 1.000 | 0.000 | 0.000 | 0.000 | 0.000 | 0.000 | 0.000 | ||
| 1 spectrum, AFIPNGPSPGSR | 0.000 | 0.890 | 0.000 | 0.000 | 0.000 | 0.000 | 0.110 | 0.000 | ||
| 3 spectra, NIVANR | 0.000 | 0.987 | 0.010 | 0.000 | 0.000 | 0.000 | 0.003 | 0.000 | ||
| 2 spectra, YVQPQGCVLEWIR | 0.000 | 1.000 | 0.000 | 0.000 | 0.000 | 0.000 | 0.000 | 0.000 | ||
| 1 spectrum, FNSGTYNNQWMIVDYK | 0.000 | 0.478 | 0.045 | 0.000 | 0.000 | 0.248 | 0.229 | 0.000 | ||
| 9 spectra, GLEDSYEGR | 0.000 | 1.000 | 0.000 | 0.000 | 0.000 | 0.000 | 0.000 | 0.000 | ||
| 2 spectra, LALDGATWADVFR | 0.000 | 1.000 | 0.000 | 0.000 | 0.000 | 0.000 | 0.000 | 0.000 | ||
| 2 spectra, VLTILEQIPGMVVVADK | 0.000 | 0.827 | 0.000 | 0.000 | 0.108 | 0.000 | 0.065 | 0.000 | ||
| 2 spectra, EMELSPDSPYWHQVR | 0.059 | 0.912 | 0.000 | 0.000 | 0.000 | 0.000 | 0.003 | 0.026 |
| Plot | Mito | Lyso or Perox | ER | Golgi | PM | Cytosol | Nucleus | ||||||
| Expt B |
7 peptides |
21 spectra |
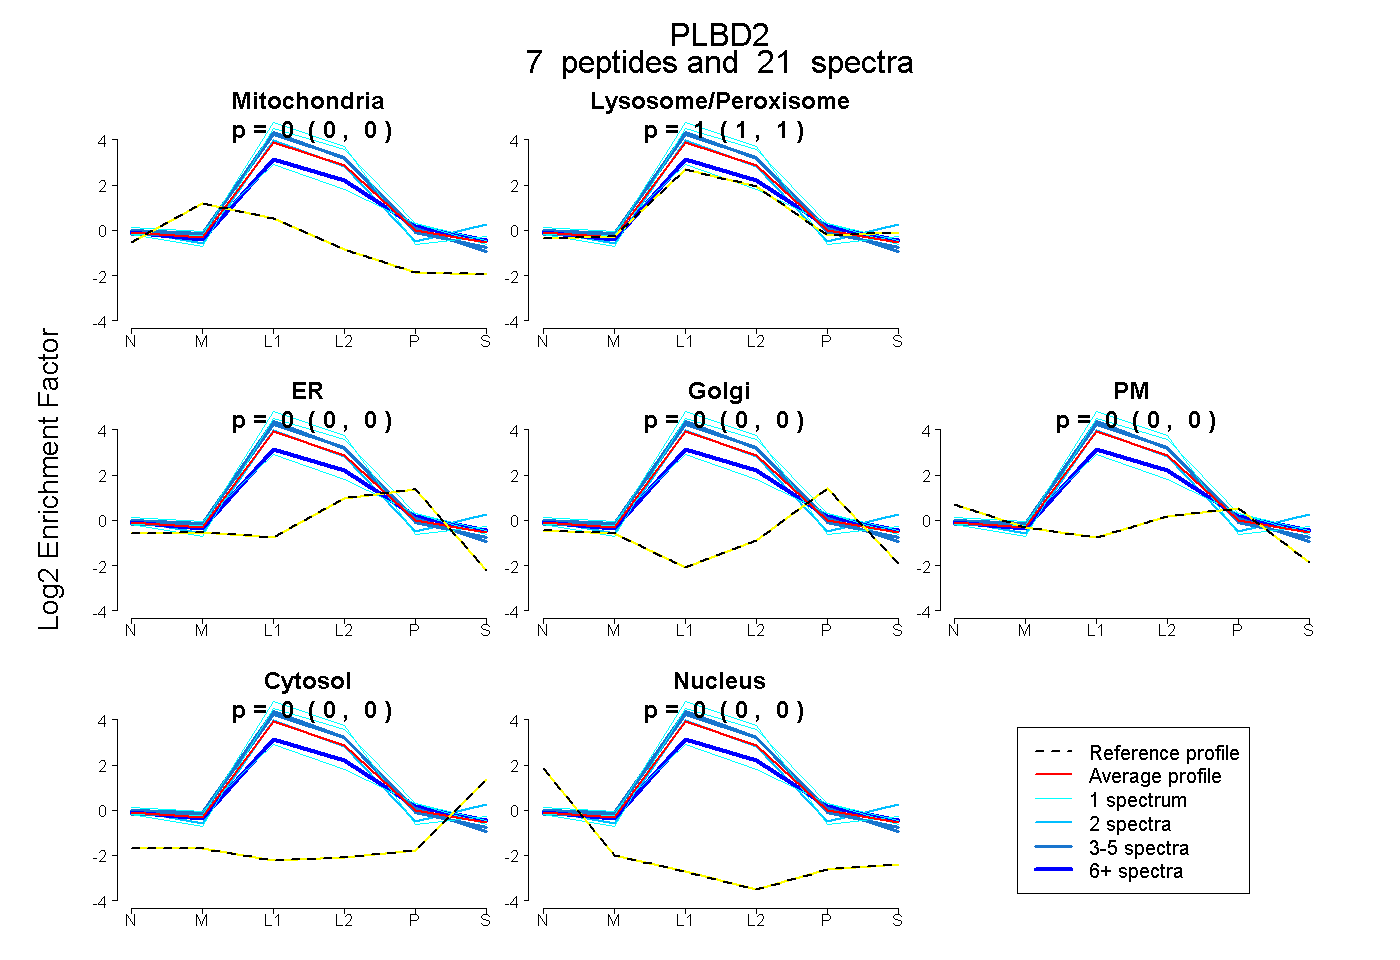 |
0.000 0.000 | 0.000 |
1.000 1.000 | 1.000 |
0.000 0.000 | 0.000 |
0.000 0.000 | 0.000 |
0.000 0.000 | 0.000 |
0.000 0.000 | 0.000 |
0.000 0.000 | 0.000 |
|||
| Plot | Lyso | Other | |||||||||||
| Expt C |
17 peptides |
227 spectra |
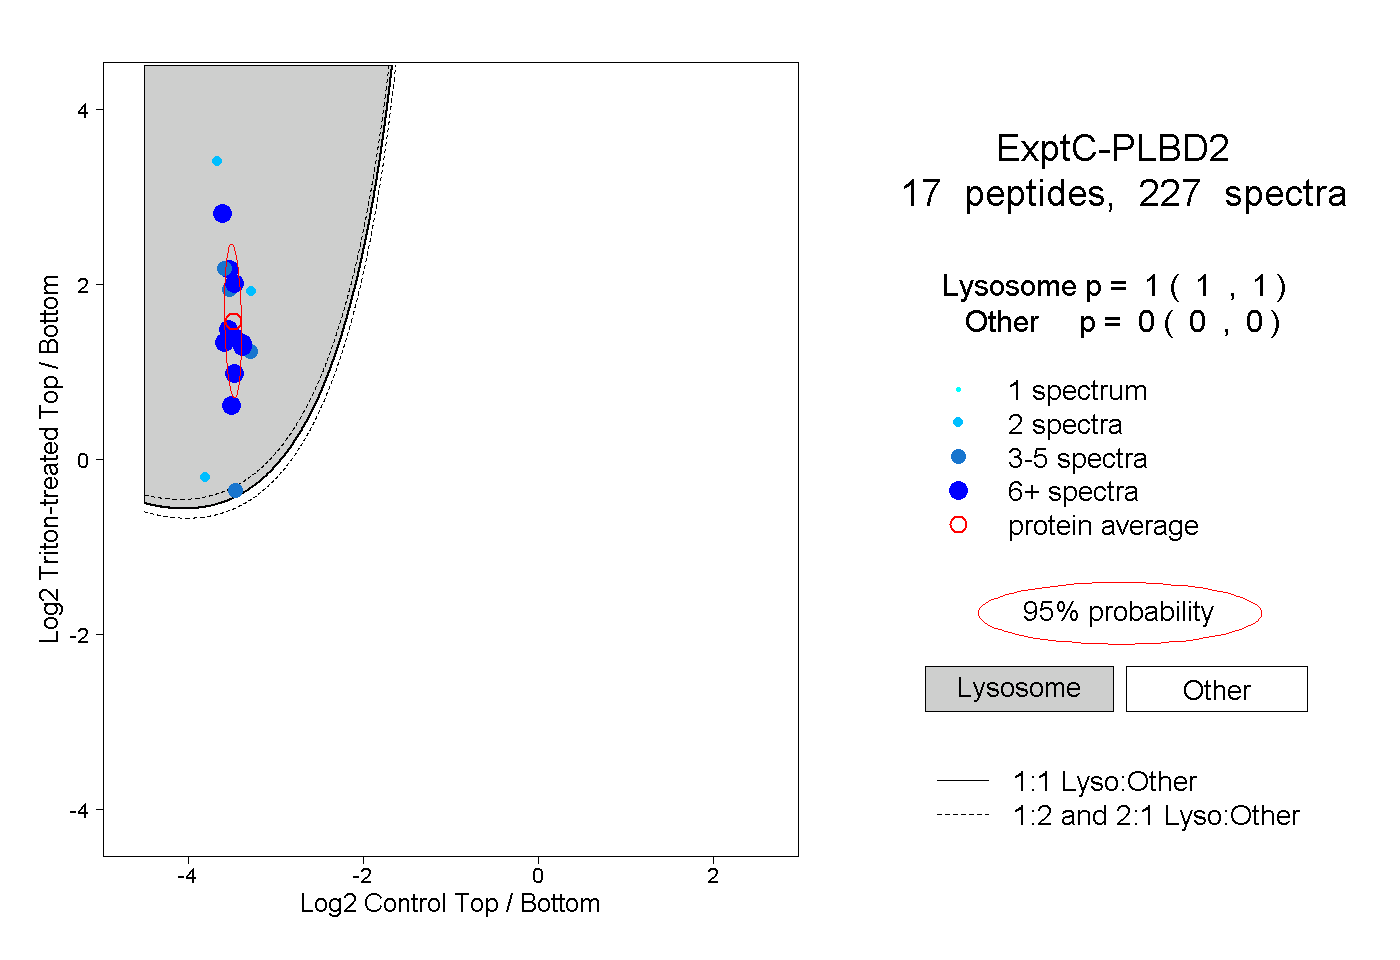 |
1.000 1.000 | 1.000 |
0.000 0.000 | 0.000 |
||||||||
| Plot | Lyso | Other | |||||||||||
| Expt D |
9 peptides |
22 spectra |
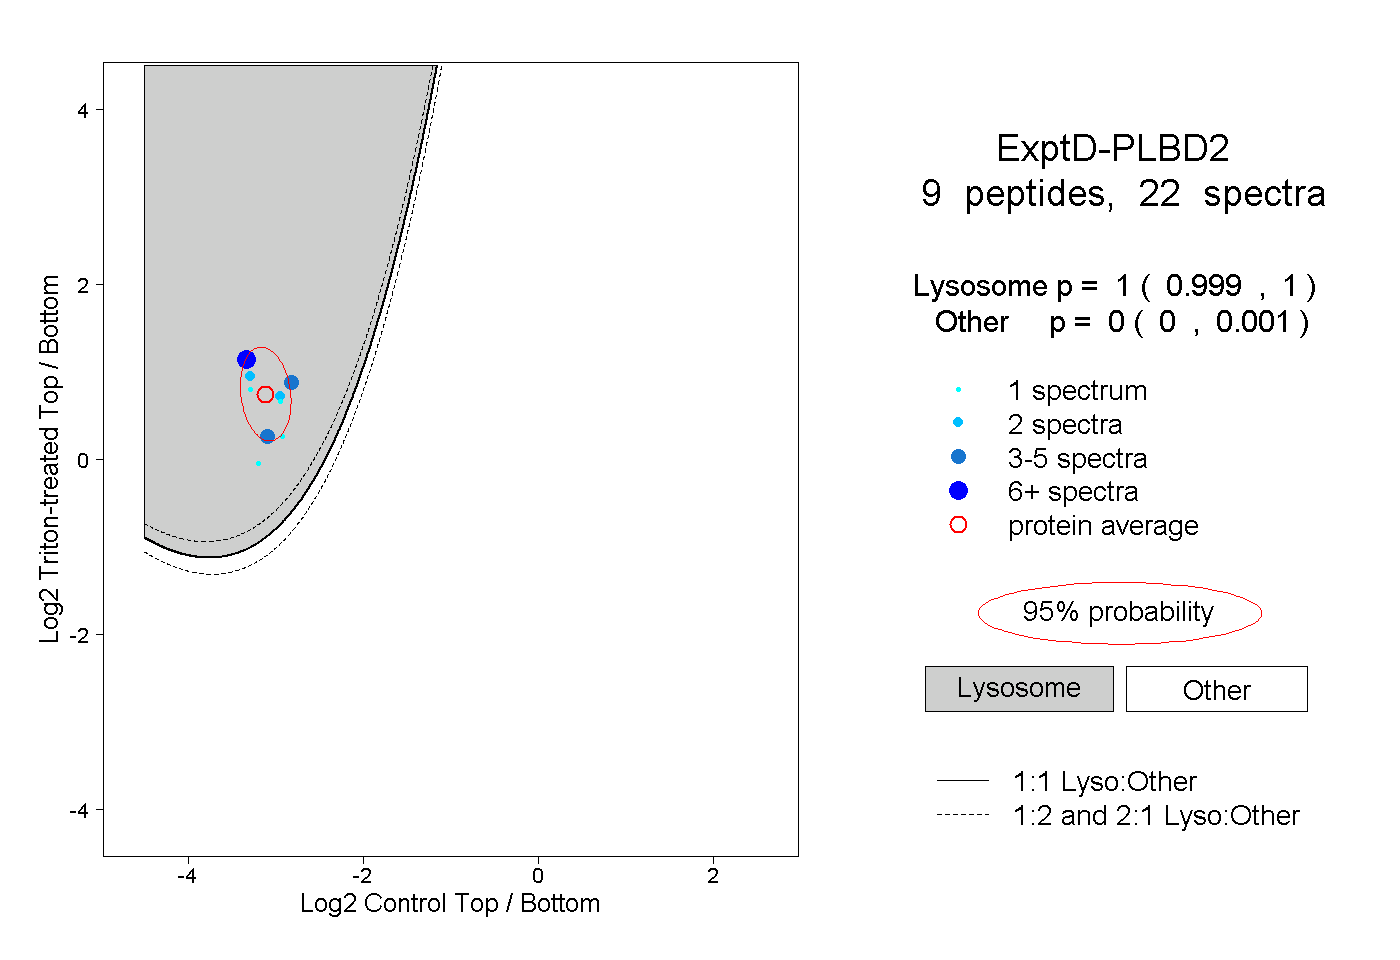 |
1.000 0.999 | 1.000 |
0.000 0.000 | 0.001 |