 2
2peptides
spectra
NA | NA
NA | NA
NA | NA
NA | NA
NA | NA
NA | NA
NA | NA
NA | NA
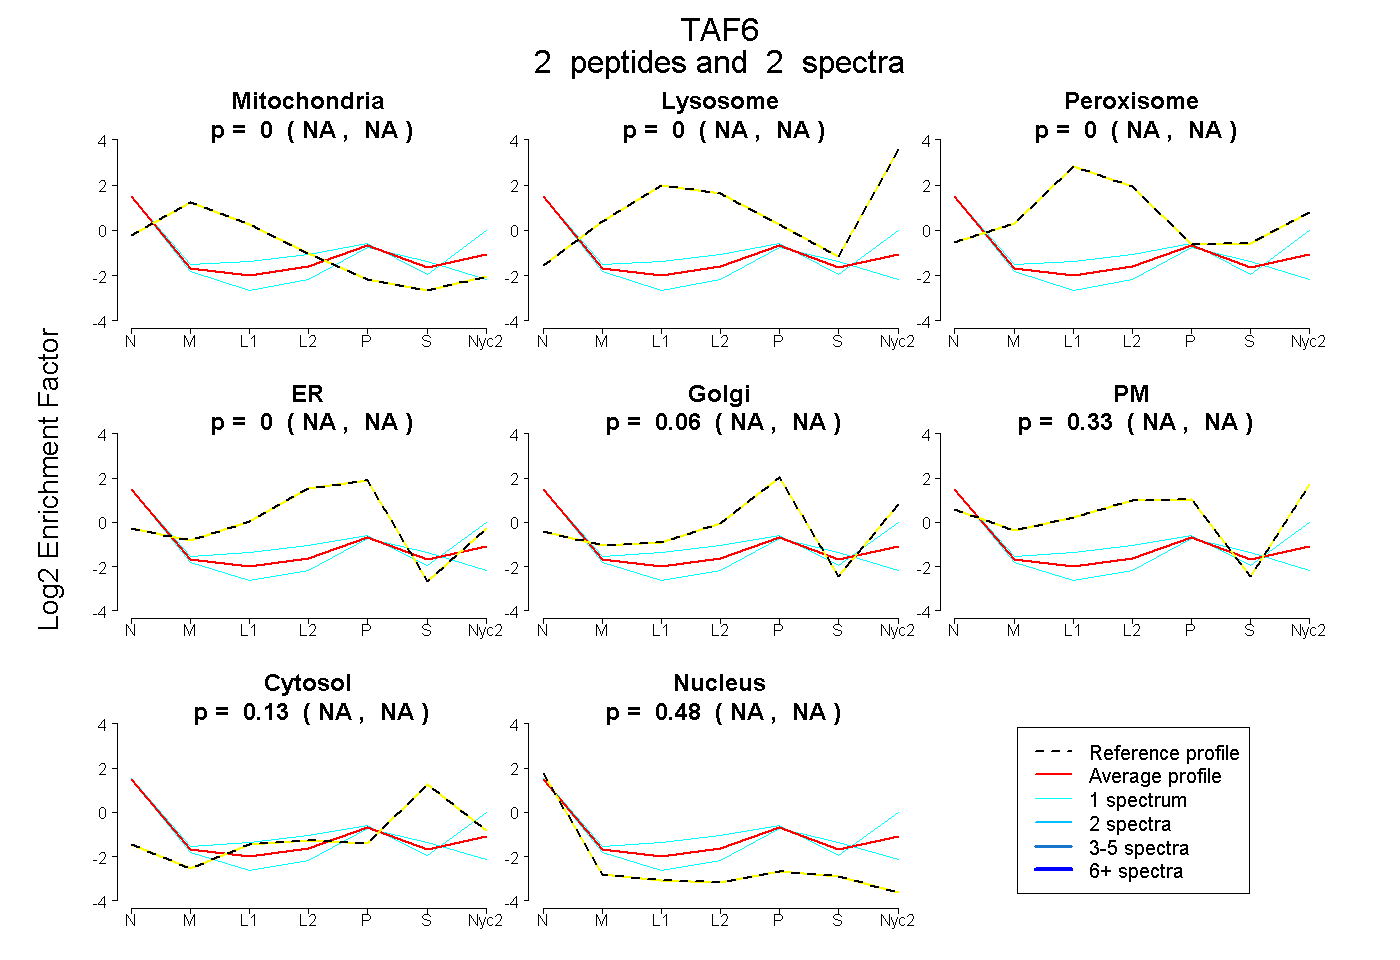
| Plot | Mito | Lyso | Perox | ER | Golgi | PM | Cytosol | Nucleus | |||||
| Expt A |
2 peptides |
2 spectra |
|
0.000 NA | NA |
0.000 NA | NA |
0.000 NA | NA |
0.000 NA | NA |
0.060 NA | NA |
0.326 NA | NA |
0.130 NA | NA |
0.485 NA | NA |
| 1 spectrum, FSTFISEGVR | 0.000 | 0.000 | 0.000 | 0.000 | 0.000 | 0.539 | 0.081 | 0.380 | ||
| 1 spectrum, TLILPR | 0.000 | 0.000 | 0.000 | 0.000 | 0.259 | 0.000 | 0.161 | 0.580 |