 4
4peptides
spectra
0.000 | 0.000
0.000 | 0.098
0.000 | 0.096
0.000 | 0.009
0.000 | 0.080
0.000 | 0.138
0.798 | 0.881
0.000 | 0.000
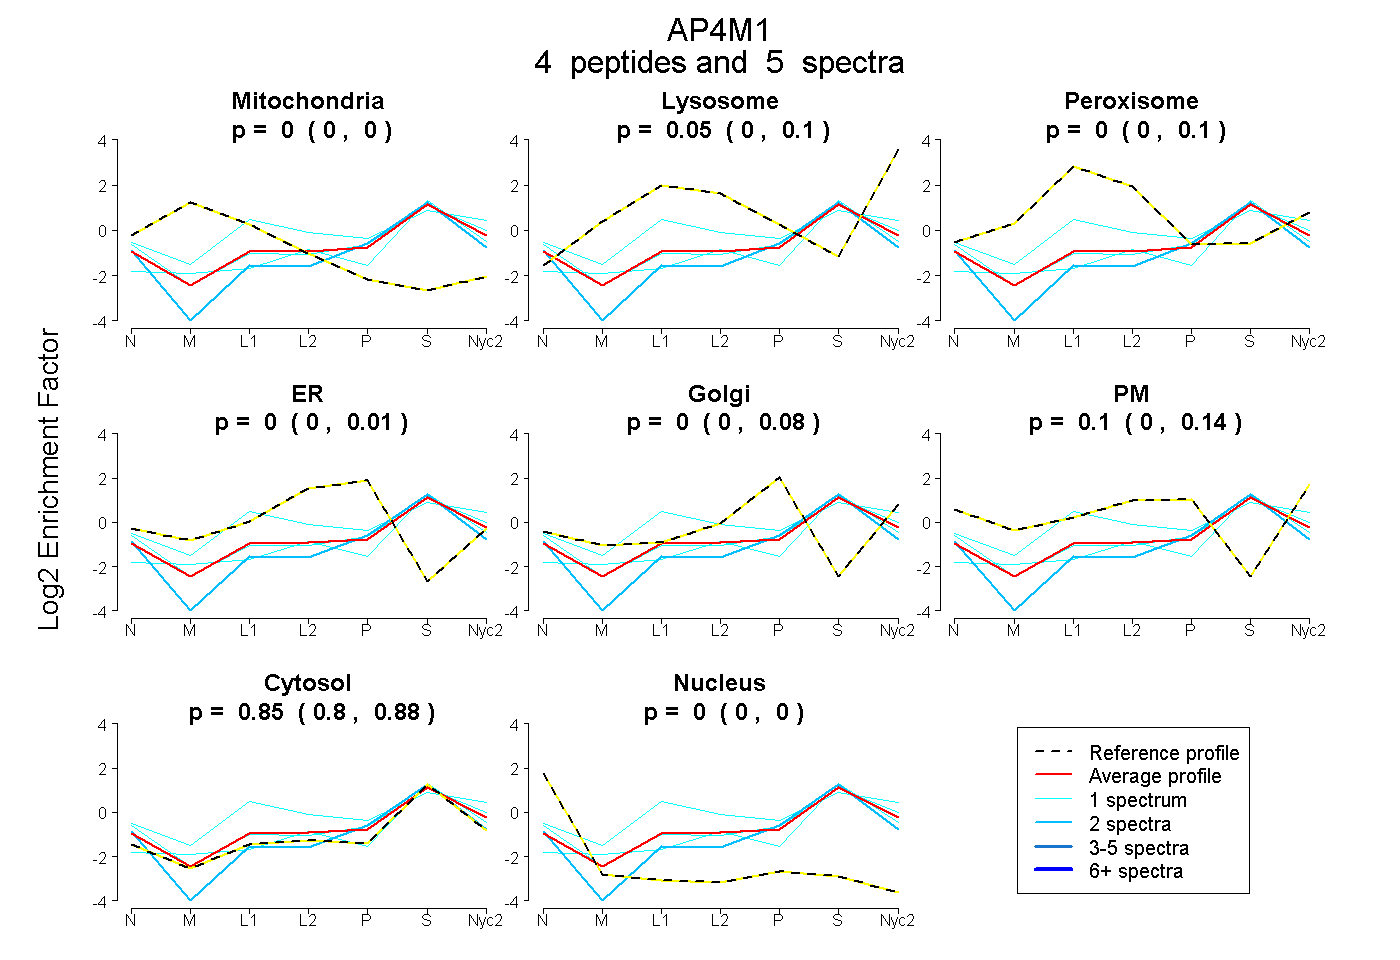
| Plot | Mito | Lyso | Perox | ER | Golgi | PM | Cytosol | Nucleus | |||||
| Expt A |
4 peptides |
5 spectra |
|
0.000 0.000 | 0.000 |
0.045 0.000 | 0.098 |
0.004 0.000 | 0.096 |
0.000 0.000 | 0.009 |
0.000 0.000 | 0.080 |
0.098 0.000 | 0.138 |
0.853 0.798 | 0.881 |
0.000 0.000 | 0.000 |
| 1 spectrum, HFIHIR | 0.000 | 0.084 | 0.297 | 0.000 | 0.000 | 0.071 | 0.548 | 0.000 | ||
| 1 spectrum, DVAELFYR | 0.000 | 0.000 | 0.000 | 0.000 | 0.000 | 0.178 | 0.822 | 0.000 | ||
| 1 spectrum, GYGPGIR | 0.000 | 0.063 | 0.000 | 0.000 | 0.000 | 0.000 | 0.937 | 0.000 | ||
| 2 spectra, VAPSSAASRPVLSSR | 0.000 | 0.000 | 0.000 | 0.000 | 0.019 | 0.000 | 0.943 | 0.038 |