 4
4peptides
spectra
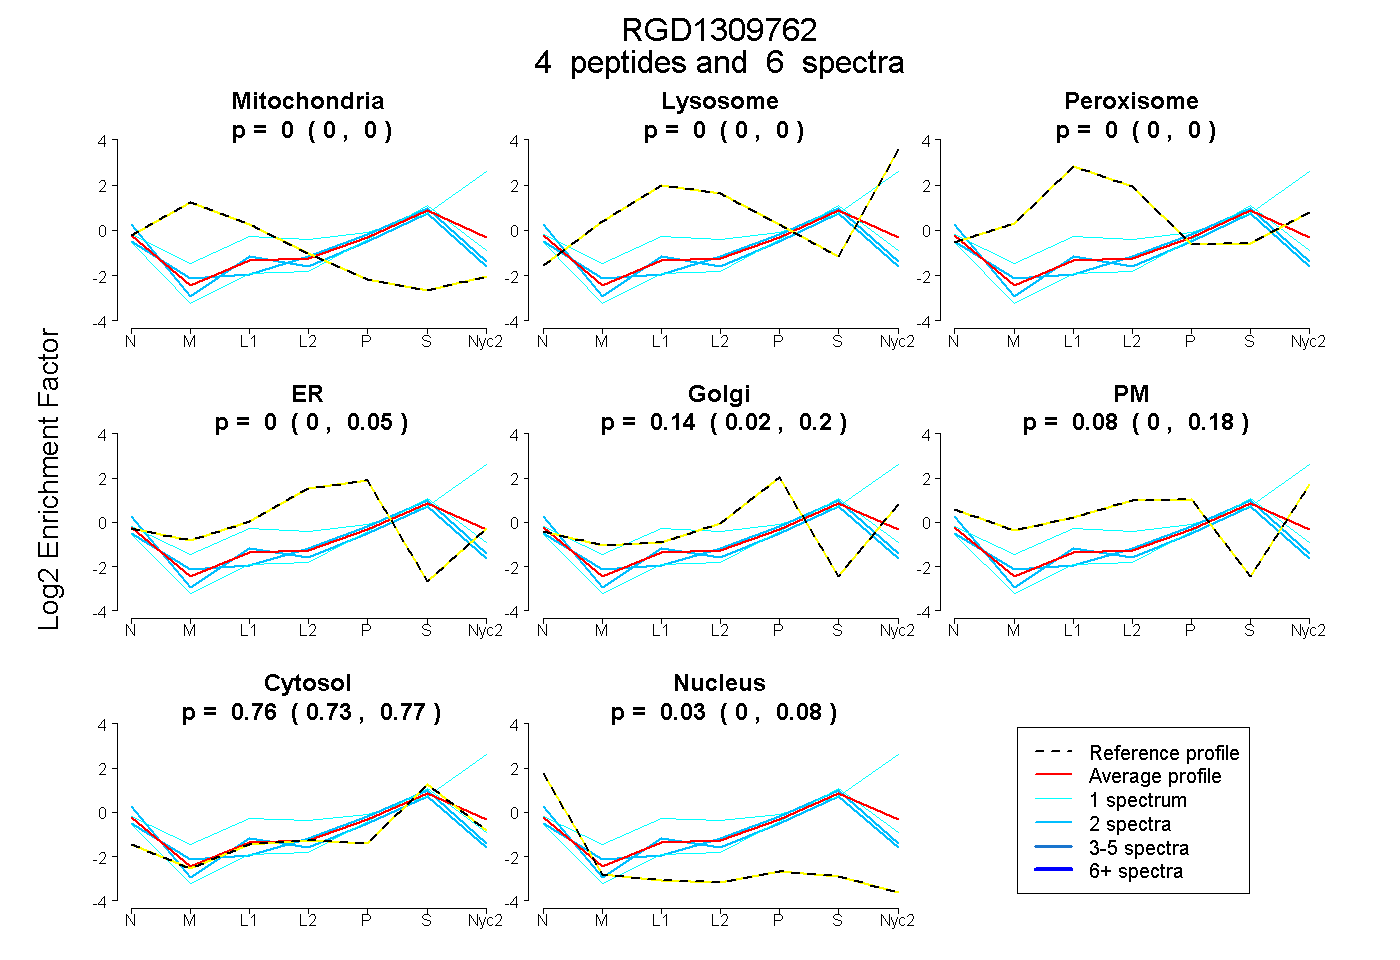
0.000 | 0.000
0.000 | 0.000
0.000 | 0.000
0.000 | 0.046
0.023 | 0.196
0.000 | 0.178
0.730 | 0.774
0.000 | 0.080
| Plot | Mito | Lyso | Perox | ER | Golgi | PM | Cytosol | Nucleus | |||||
| Expt A |
4 peptides |
6 spectra |
|
0.000 0.000 | 0.000 |
0.000 0.000 | 0.000 |
0.000 0.000 | 0.000 |
0.000 0.000 | 0.046 |
0.138 0.023 | 0.196 |
0.077 0.000 | 0.178 |
0.756 0.730 | 0.774 |
0.030 0.000 | 0.080 |
| 1 spectrum, LVPGAR | 0.000 | 0.000 | 0.000 | 0.000 | 0.070 | 0.000 | 0.840 | 0.090 | ||
| 1 spectrum, LFPDER | 0.000 | 0.397 | 0.000 | 0.000 | 0.000 | 0.134 | 0.469 | 0.000 | ||
| 2 spectra, LFHIPAIR | 0.000 | 0.000 | 0.000 | 0.103 | 0.000 | 0.000 | 0.705 | 0.191 | ||
| 2 spectra, LPHLFTR | 0.000 | 0.000 | 0.000 | 0.034 | 0.120 | 0.000 | 0.758 | 0.088 |
| Plot | Mito | Lyso or Perox | ER | Golgi | PM | Cytosol | Nucleus | ||||||
| Expt B |
1 peptide |
1 spectrum |
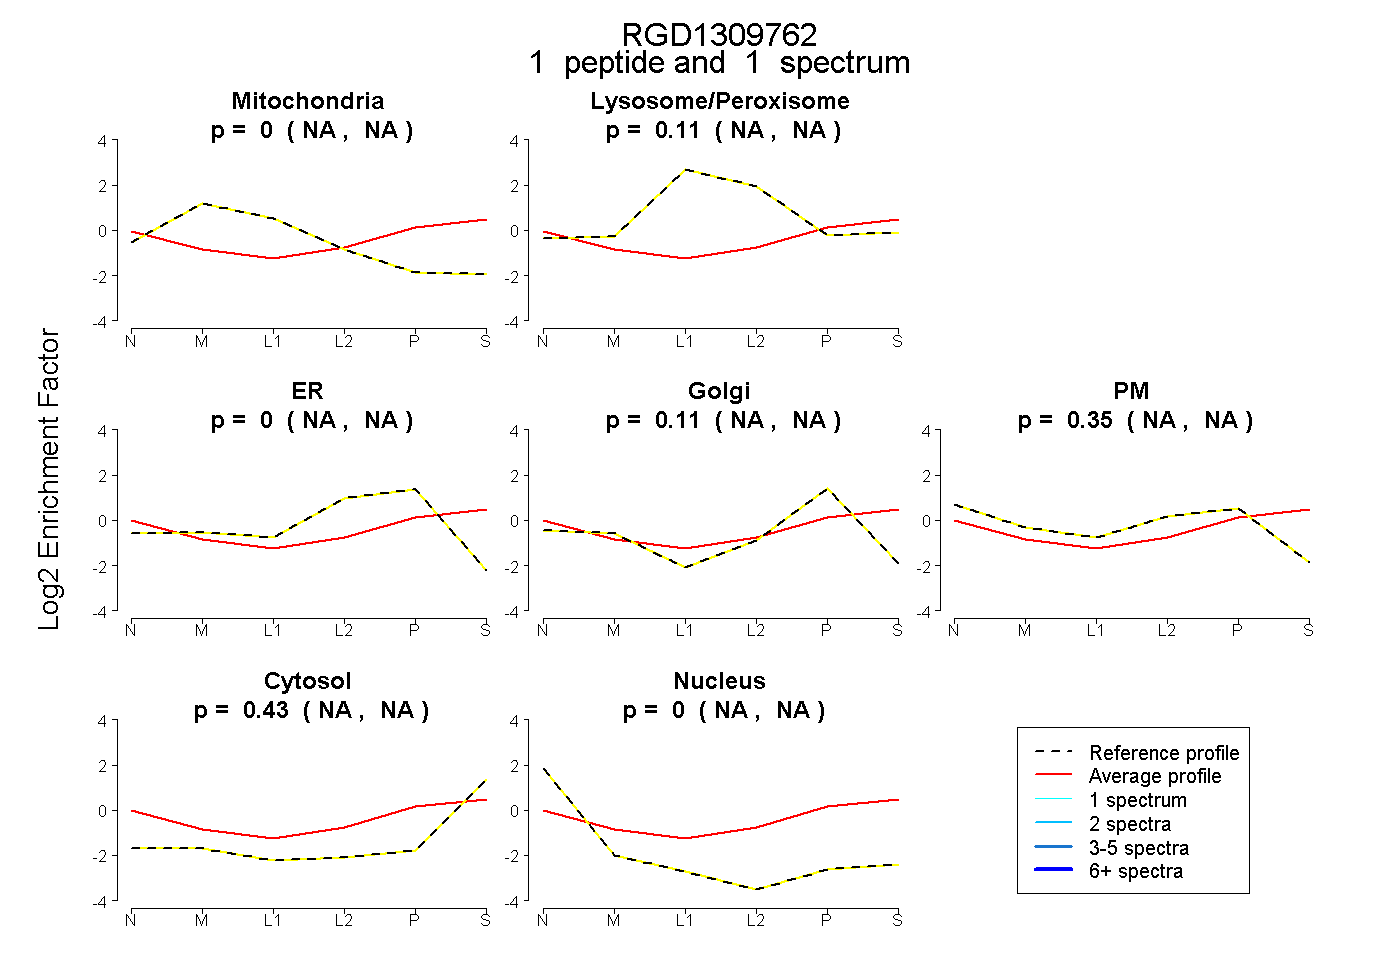 |
0.000 NA | NA |
0.110 NA | NA |
0.000 NA | NA |
0.106 NA | NA |
0.354 NA | NA |
0.430 NA | NA |
0.000 NA | NA |
|||
| Plot | Lyso | Other | |||||||||||
| Expt C |
1 peptide |
2 spectra |
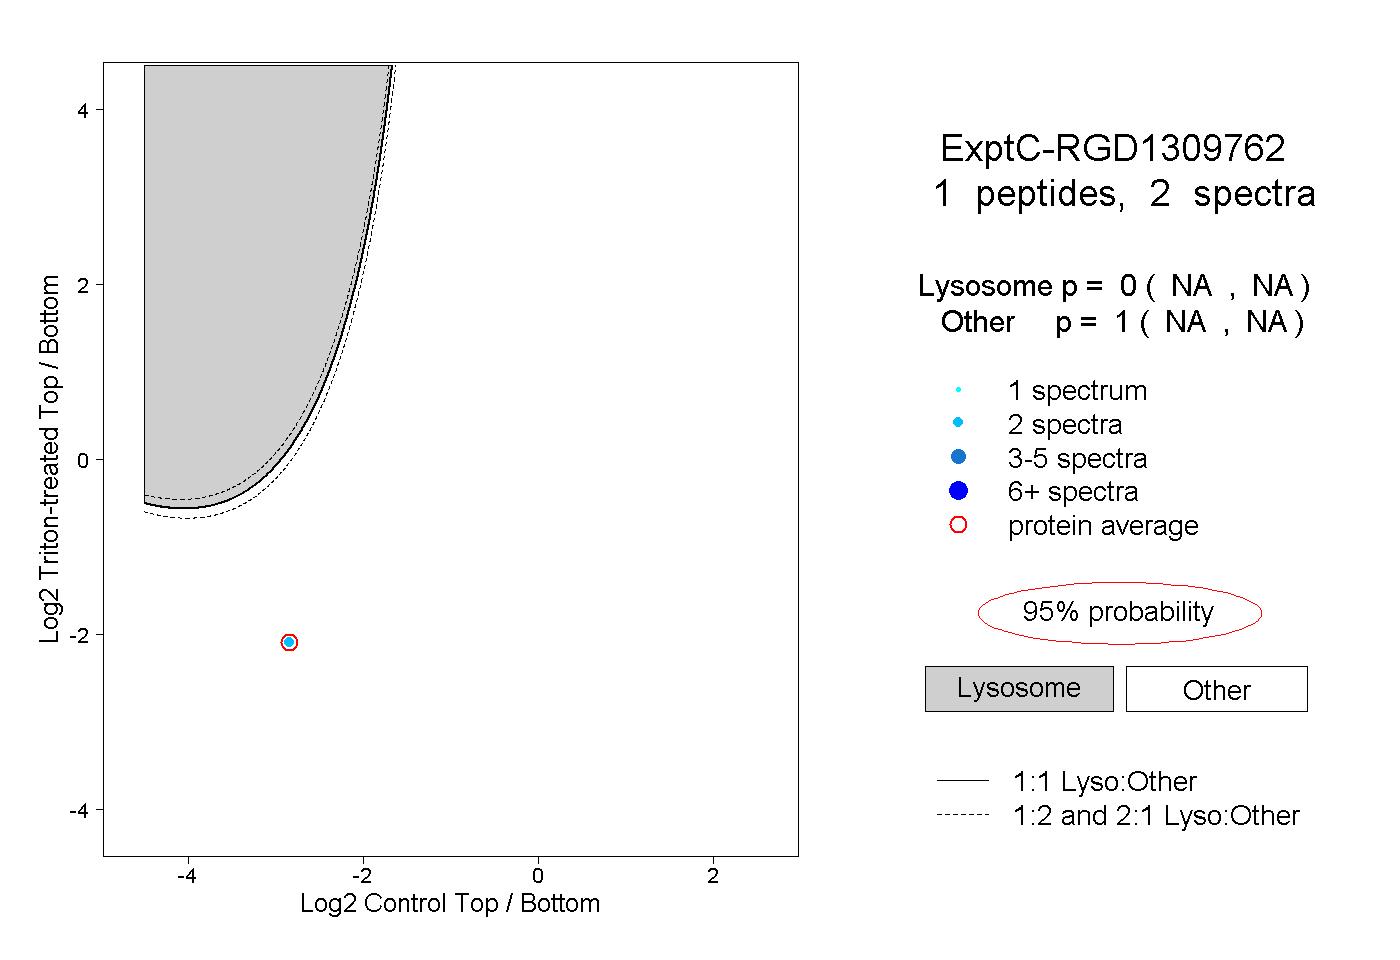 |
0.000 NA | NA |
1.000 NA | NA |