 5
5peptides
spectra
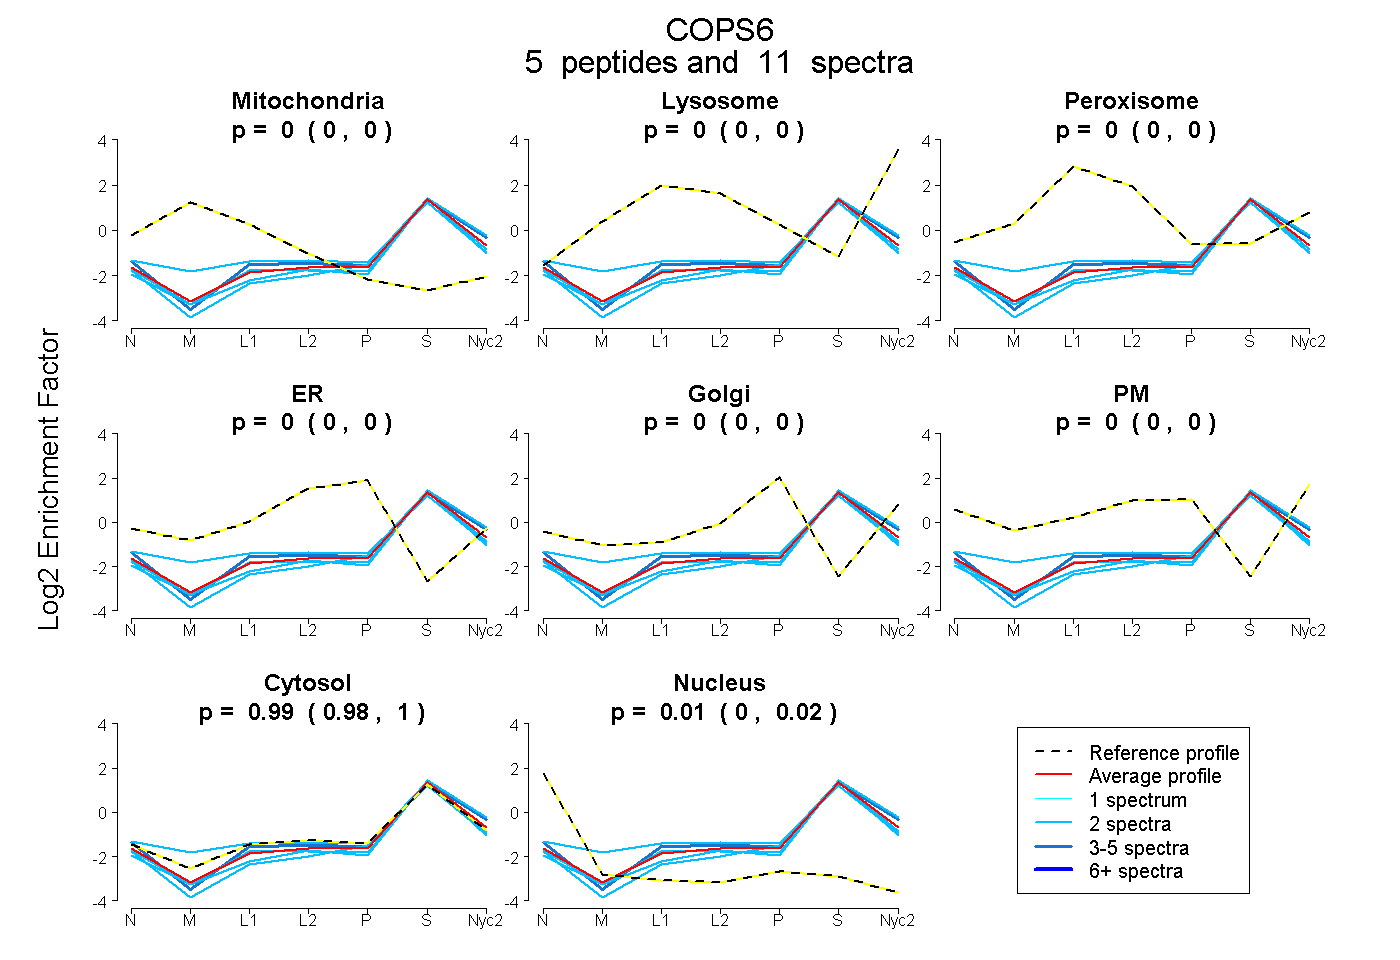
0.000 | 0.000
0.000 | 0.000
0.000 | 0.000
0.000 | 0.000
0.000 | 0.000
0.000 | 0.000
0.981 | 1.000
0.000 | 0.017
3peptides
spectra
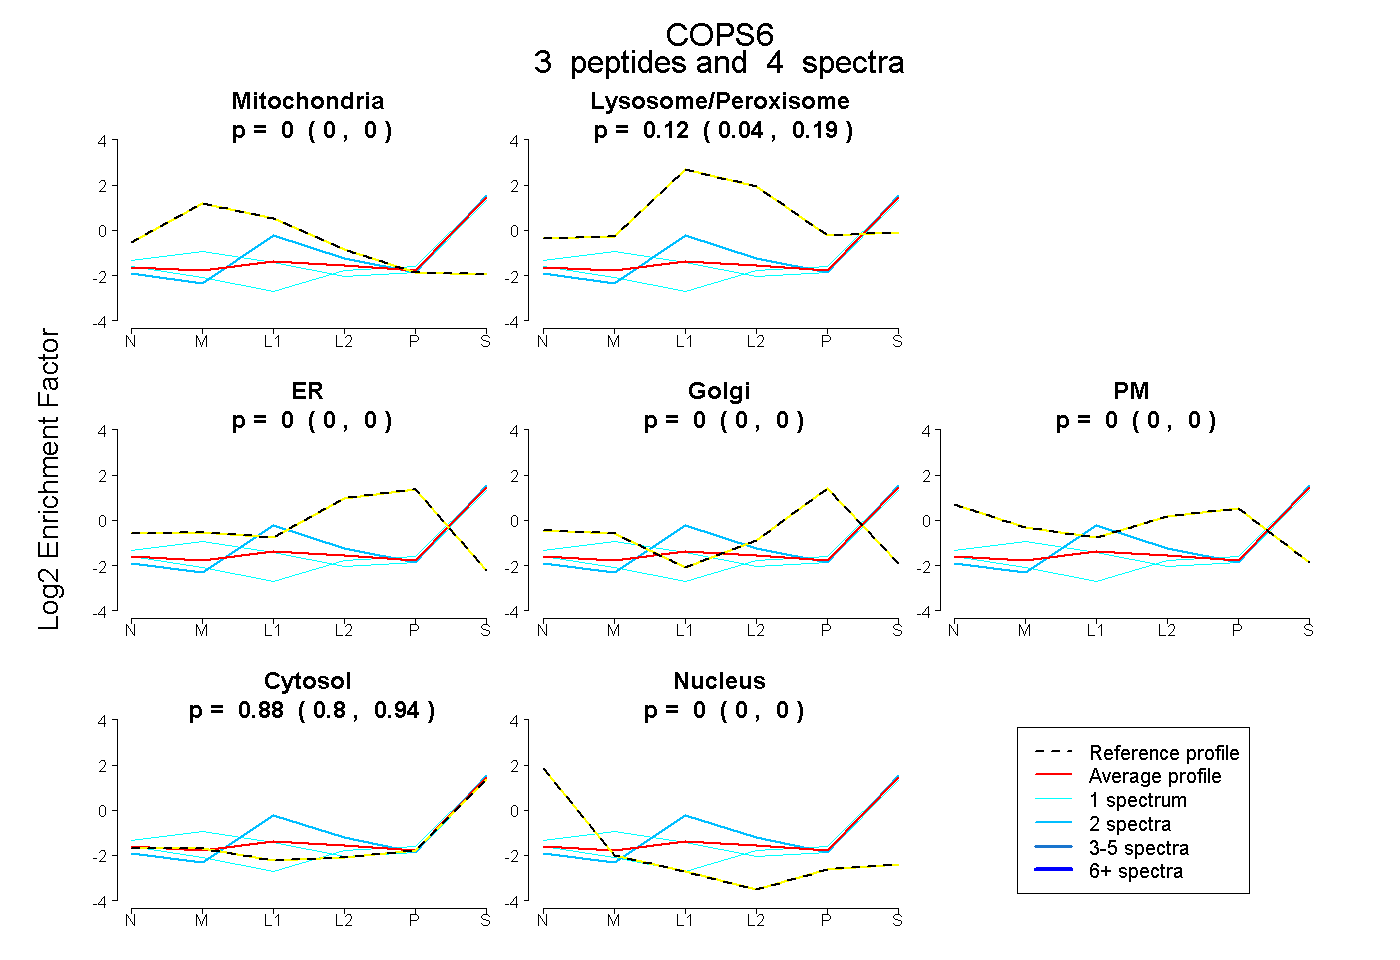
0.000 | 0.000
0.045 | 0.189
0.000 | 0.000
0.000 | 0.000
0.000 | 0.000
0.798 | 0.941
0.000 | 0.000
5peptides
spectra
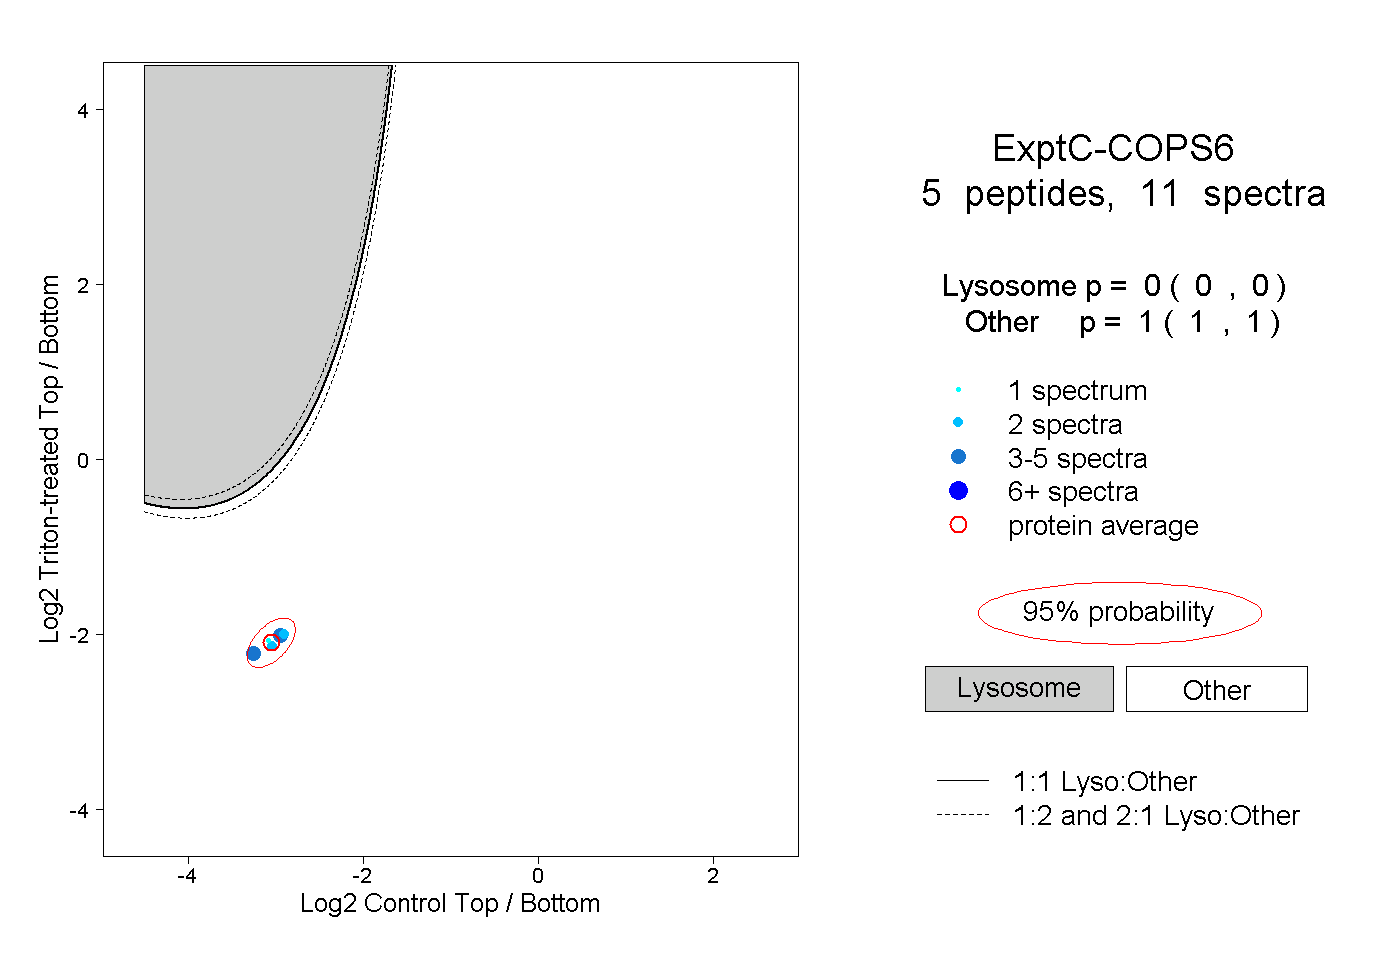
0.000 | 0.000
1.000 | 1.000