 10
10peptides
spectra
0.000 | 0.000
0.353 | 0.379
0.000 | 0.000
0.155 | 0.208
0.145 | 0.193
0.000 | 0.000
0.268 | 0.286
0.000 | 0.000
| Plot | Mito | Lyso | Perox | ER | Golgi | PM | Cytosol | Nucleus | |||||
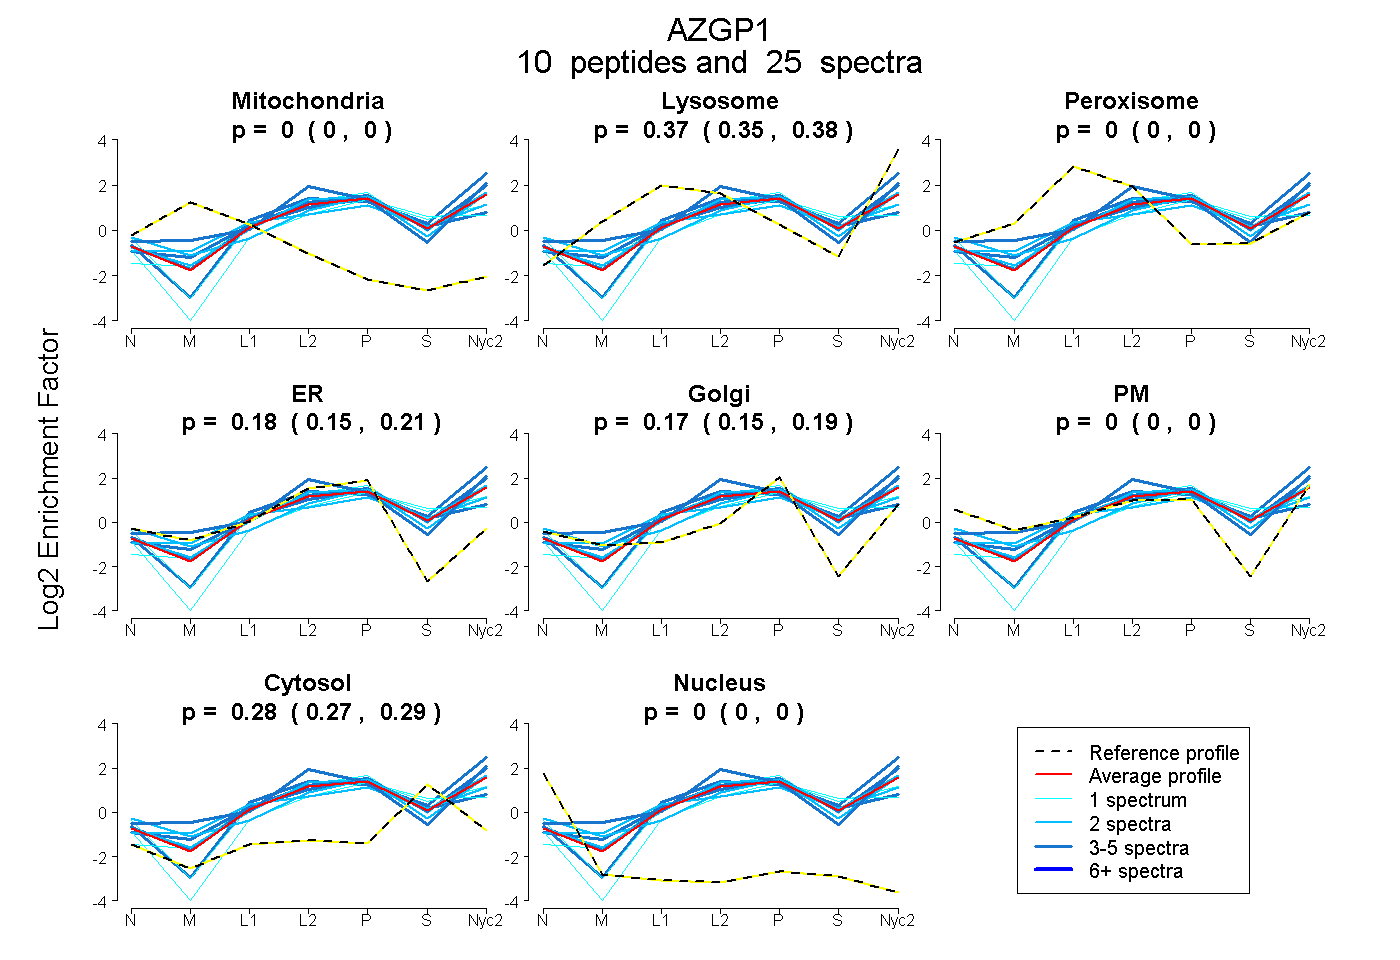
| Expt A |
10 peptides |
25 spectra |
|
0.000 0.000 | 0.000 |
0.367 0.353 | 0.379 |
0.000 0.000 | 0.000 |
0.184 0.155 | 0.208 |
0.171 0.145 | 0.193 |
0.000 0.000 | 0.000 |
0.278 0.268 | 0.286 |
0.000 0.000 | 0.000 |
| 1 spectrum, DPFVCHIEHK | 0.000 | 0.090 | 0.000 | 0.247 | 0.127 | 0.000 | 0.536 | 0.000 | ||
| 2 spectra, TDPPTVK | 0.000 | 0.259 | 0.000 | 0.000 | 0.365 | 0.169 | 0.207 | 0.000 | ||
| 1 spectrum, EEIFLVTLK | 0.000 | 0.334 | 0.000 | 0.079 | 0.306 | 0.029 | 0.251 | 0.000 | ||
| 4 spectra, AEPVEPWSHVEGMEDWEK | 0.000 | 0.478 | 0.000 | 0.000 | 0.229 | 0.000 | 0.293 | 0.000 | ||
| 4 spectra, ESQLAGR | 0.000 | 0.463 | 0.000 | 0.072 | 0.261 | 0.000 | 0.204 | 0.000 | ||
| 5 spectra, CLAYDFYPQR | 0.000 | 0.268 | 0.000 | 0.393 | 0.000 | 0.000 | 0.338 | 0.000 | ||
| 1 spectrum, AYLEEECPTMLK | 0.000 | 0.386 | 0.000 | 0.247 | 0.000 | 0.000 | 0.366 | 0.000 | ||
| 2 spectra, LASEPER | 0.000 | 0.386 | 0.000 | 0.199 | 0.159 | 0.000 | 0.256 | 0.000 | ||
| 3 spectra, YLTYSR | 0.000 | 0.444 | 0.000 | 0.237 | 0.049 | 0.165 | 0.105 | 0.000 | ||
| 2 spectra, GLSQSLSVQWDEK | 0.000 | 0.375 | 0.019 | 0.189 | 0.101 | 0.000 | 0.316 | 0.000 |
| Plot | Mito | Lyso or Perox | ER | Golgi | PM | Cytosol | Nucleus | ||||||
| Expt B |
3 peptides |
6 spectra |
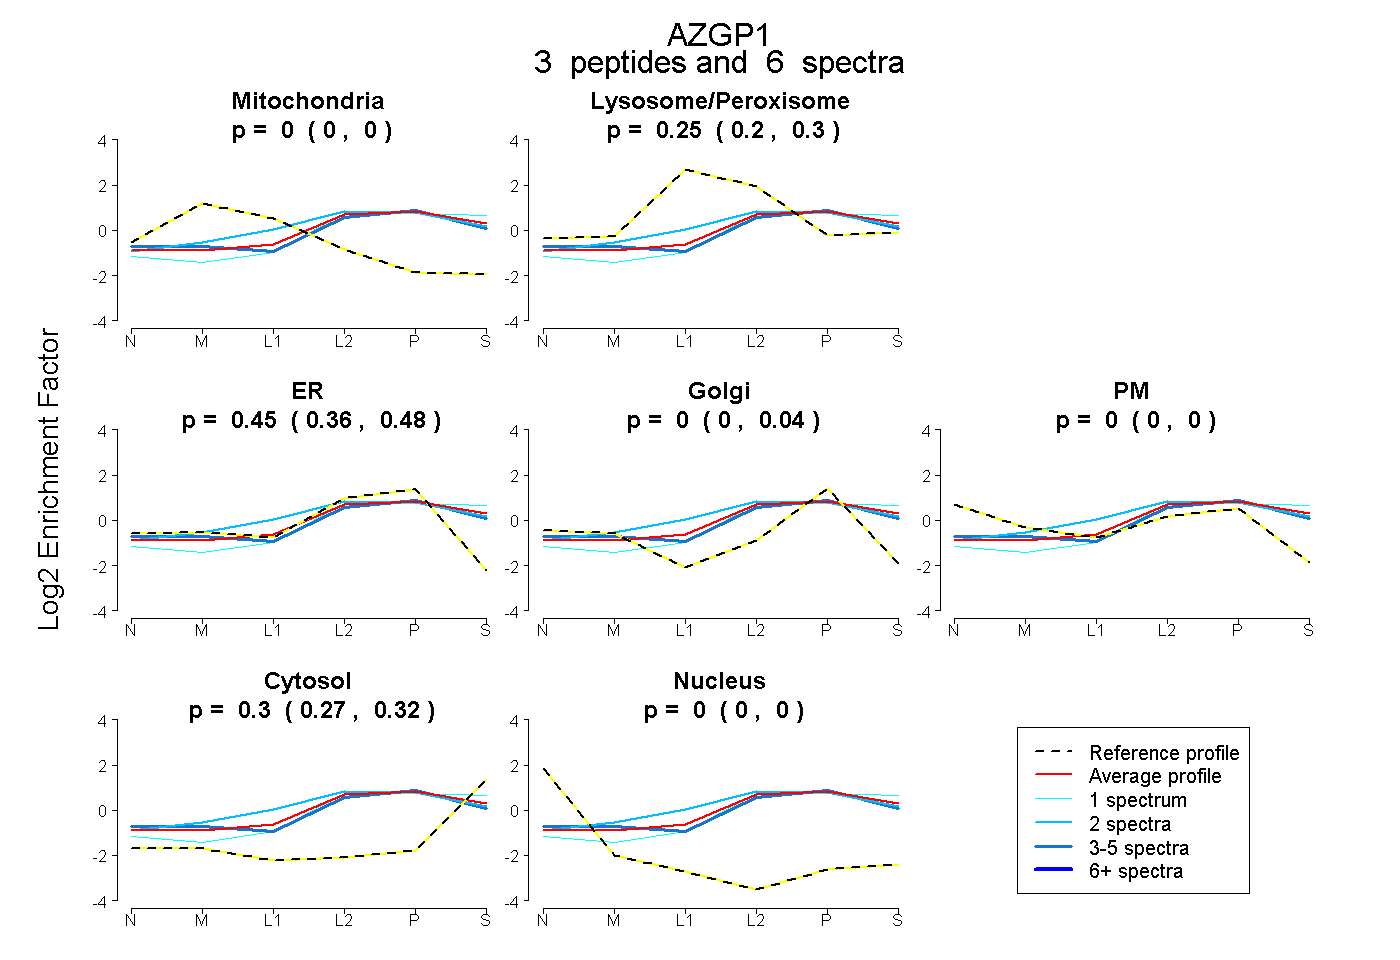 |
0.000 0.000 | 0.000 |
0.250 0.200 | 0.303 |
0.447 0.358 | 0.480 |
0.000 0.000 | 0.041 |
0.000 0.000 | 0.000 |
0.303 0.268 | 0.323 |
0.000 0.000 | 0.000 |
|||
| Plot | Lyso | Other | |||||||||||
| Expt C |
9 peptides |
37 spectra |
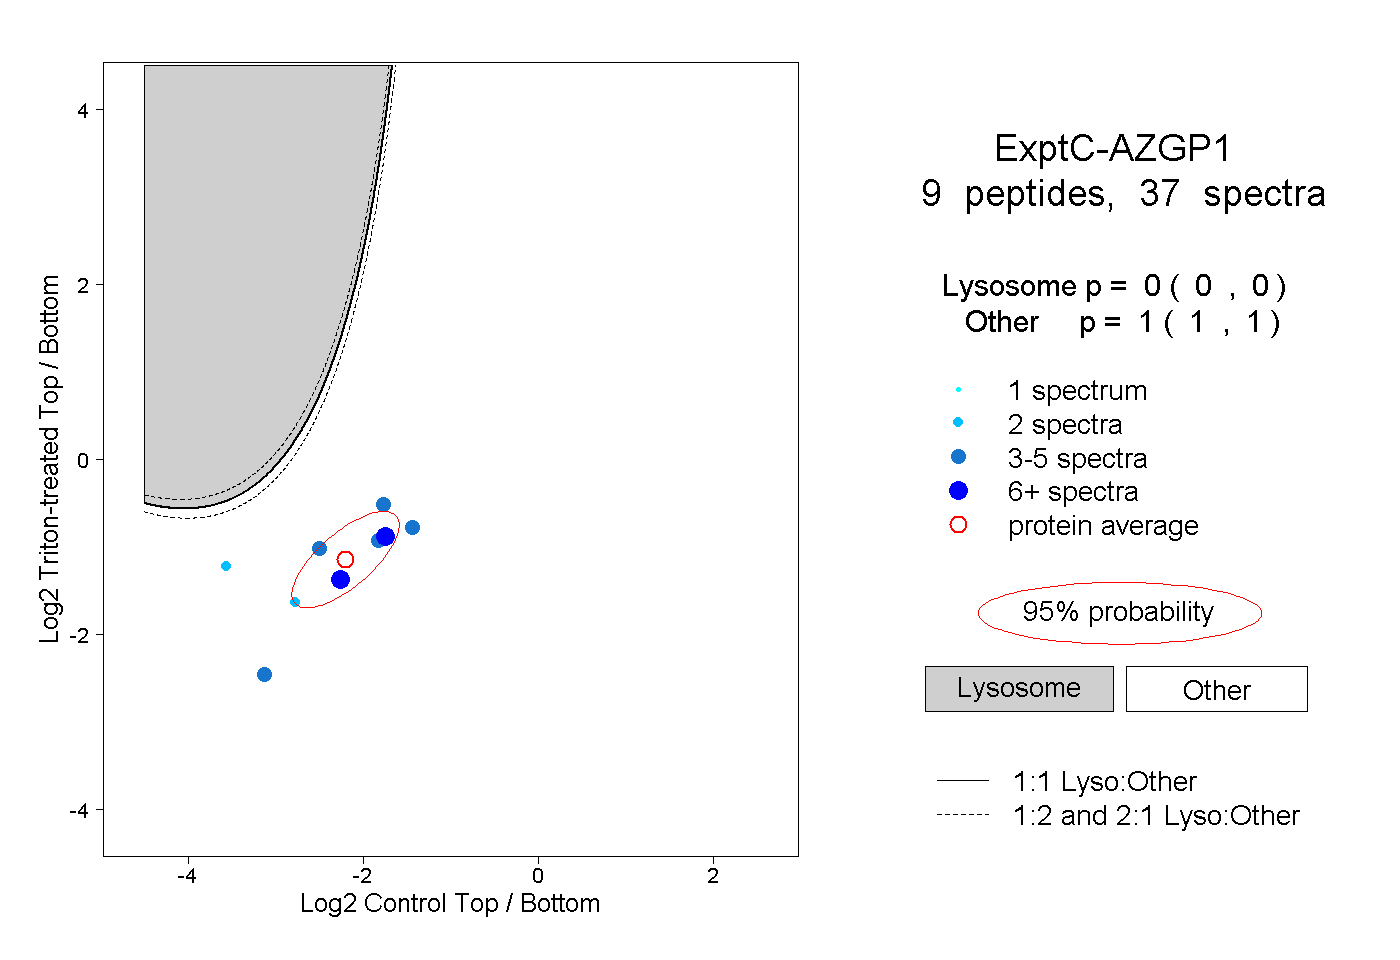 |
0.000 0.000 | 0.000 |
1.000 1.000 | 1.000 |
||||||||
| Plot | Lyso | Other | |||||||||||
| Expt D |
2 peptides |
2 spectra |
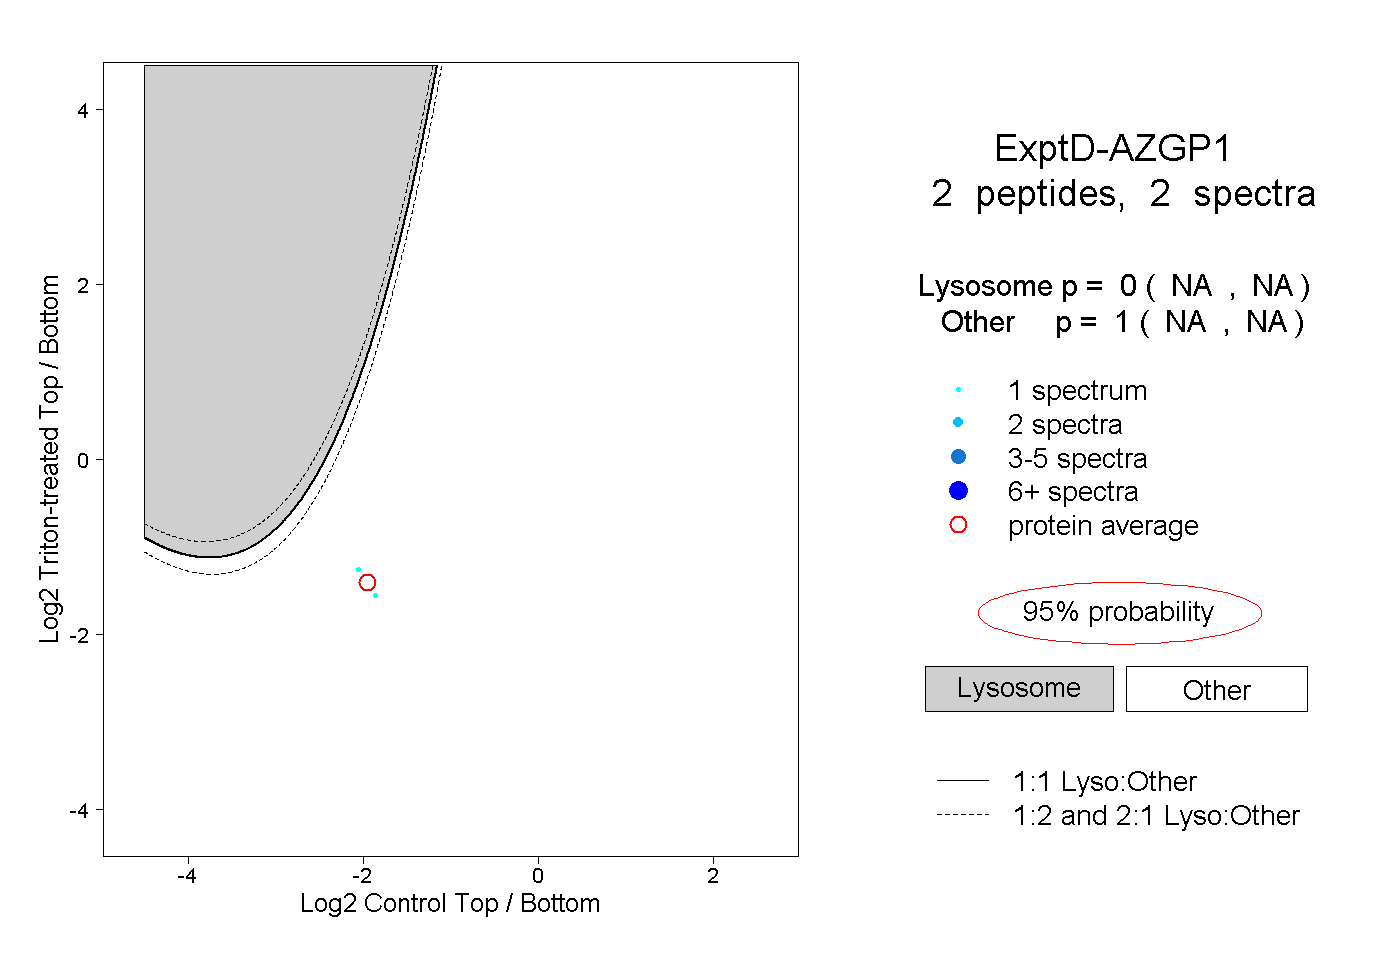 |
0.000 NA | NA |
1.000 NA | NA |