 2
2peptides
spectra
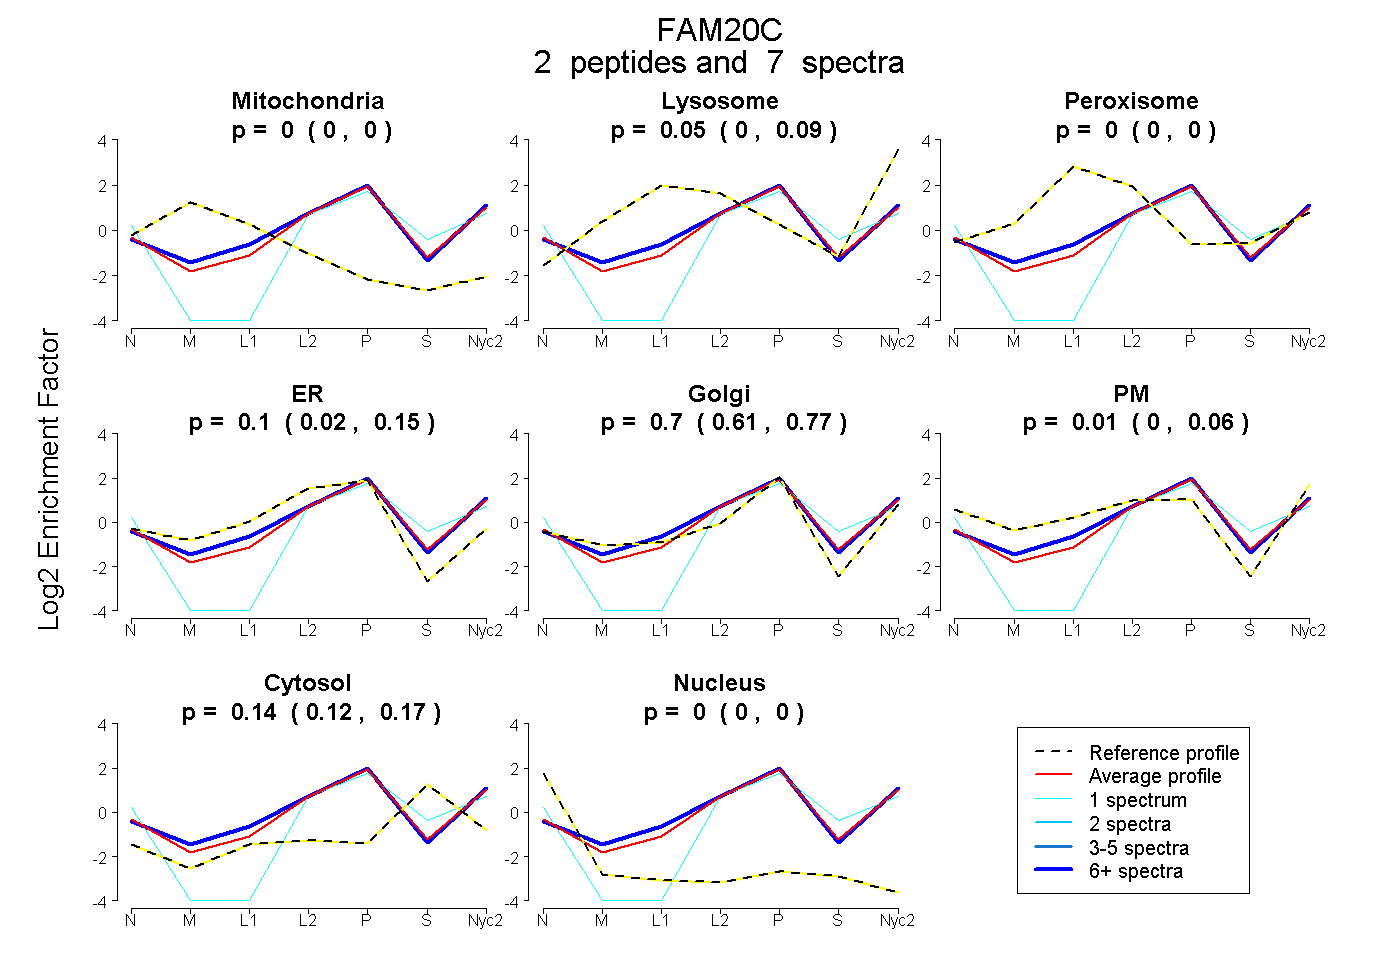
0.000 | 0.000
0.000 | 0.085
0.000 | 0.000
0.024 | 0.152
0.609 | 0.772
0.000 | 0.058
0.116 | 0.169
0.000 | 0.000
2peptides
spectra
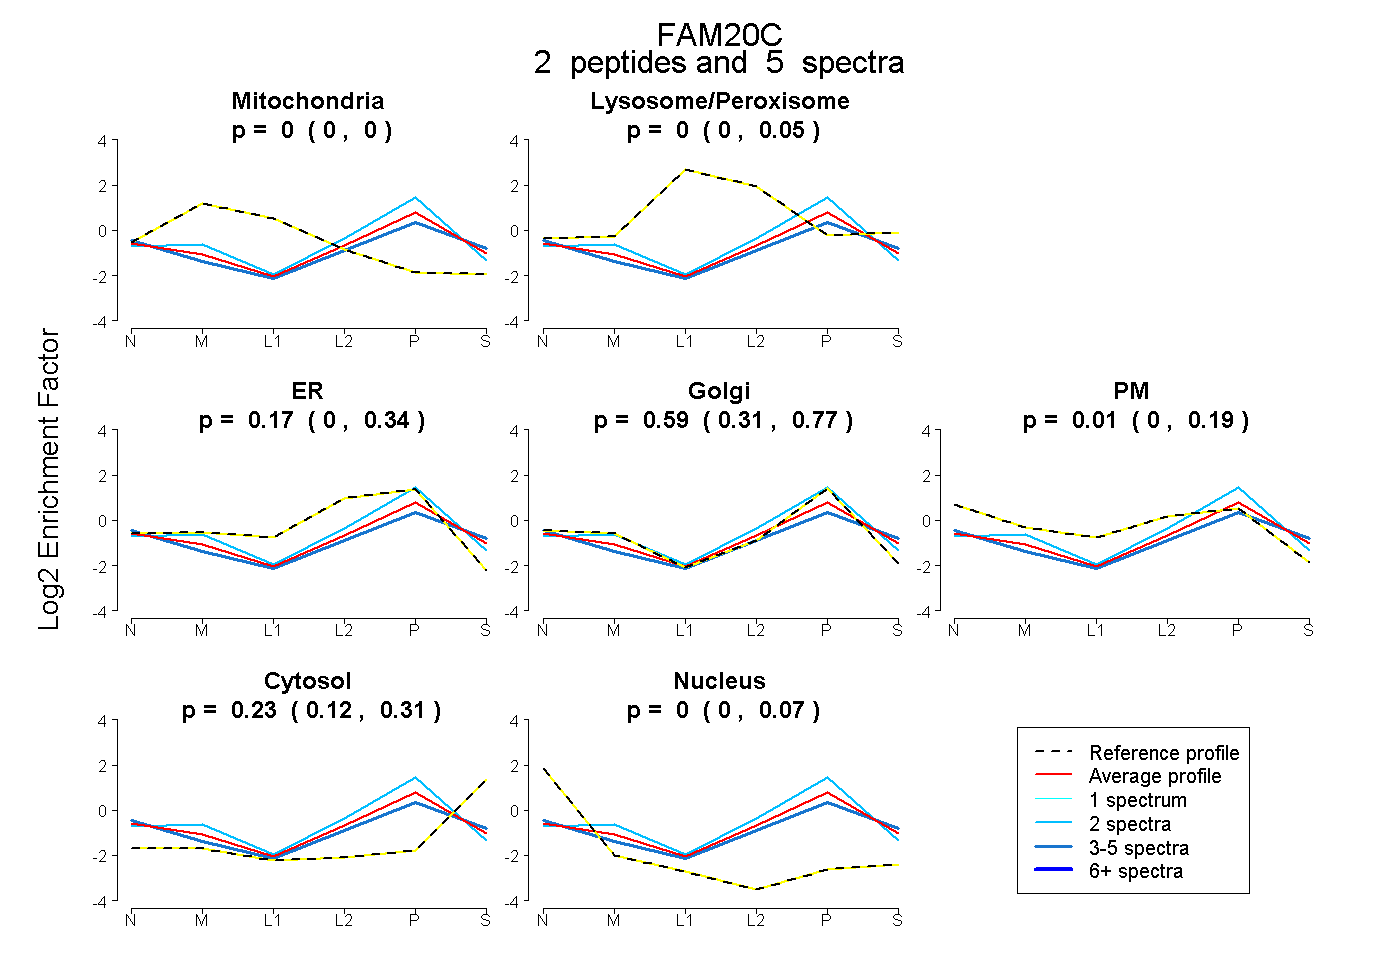
0.000 | 0.000
0.000 | 0.049
0.000 | 0.343
0.306 | 0.767
0.000 | 0.191
0.123 | 0.311
0.000 | 0.067
4peptides
spectra
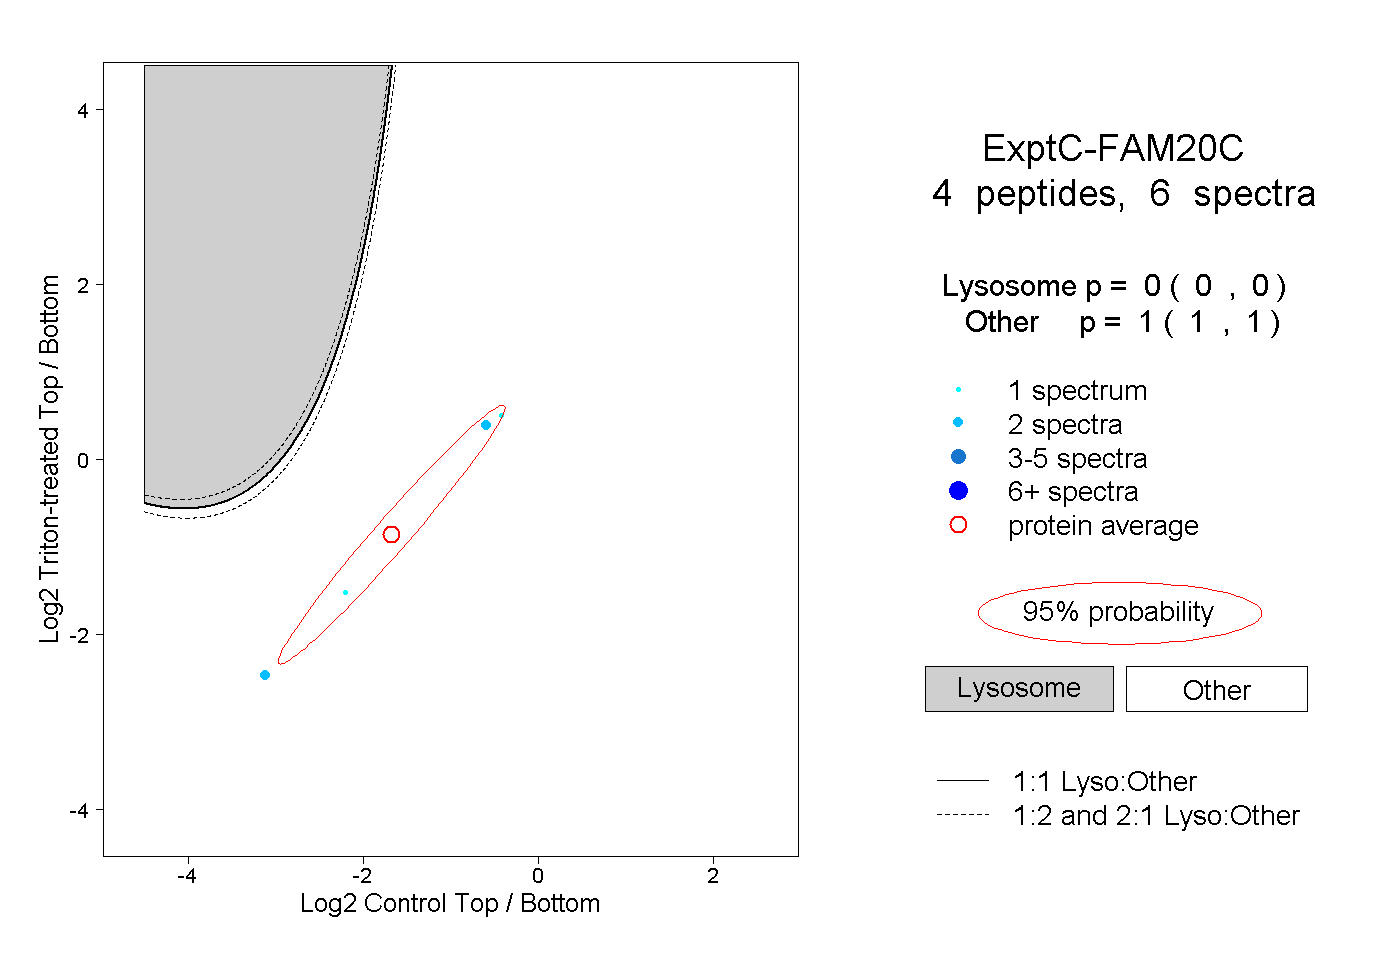
0.000 | 0.000
1.000 | 1.000