 4
4peptides
spectra
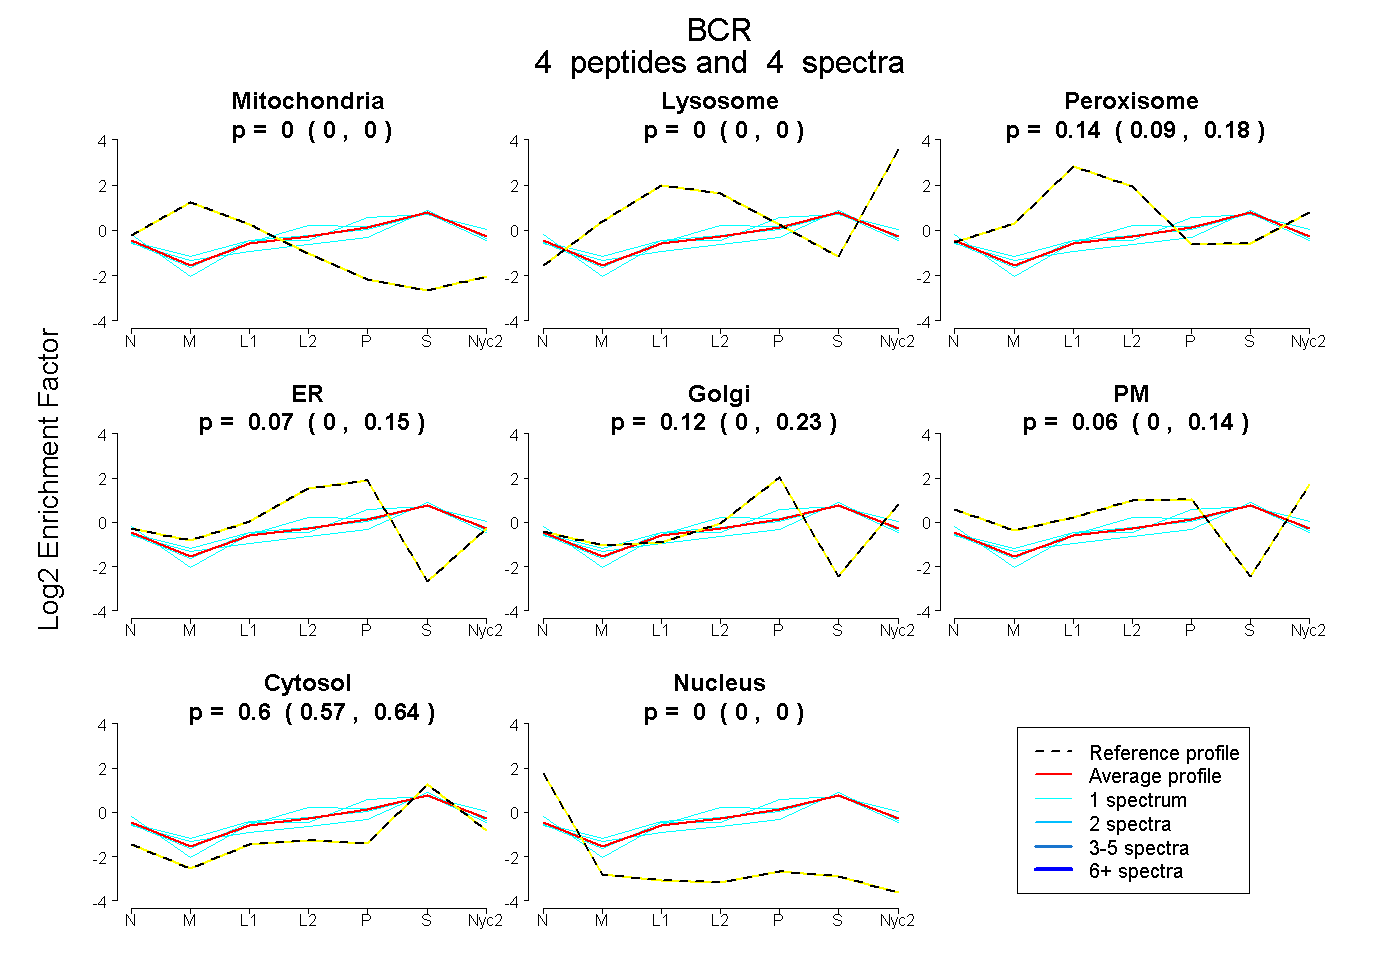
0.000 | 0.000
0.000 | 0.000
0.088 | 0.177
0.000 | 0.145
0.000 | 0.227
0.000 | 0.144
0.569 | 0.635
0.000 | 0.000
| Plot | Mito | Lyso | Perox | ER | Golgi | PM | Cytosol | Nucleus | |||||
| Expt A |
4 peptides |
4 spectra |
|
0.000 0.000 | 0.000 |
0.000 0.000 | 0.000 |
0.140 0.088 | 0.177 |
0.069 0.000 | 0.145 |
0.125 0.000 | 0.227 |
0.064 0.000 | 0.144 |
0.603 0.569 | 0.635 |
0.000 0.000 | 0.000 |
| 1 spectrum, ASELDLEK | 0.000 | 0.000 | 0.237 | 0.004 | 0.208 | 0.000 | 0.551 | 0.000 | ||
| 1 spectrum, VPELYEIHK | 0.000 | 0.000 | 0.098 | 0.000 | 0.087 | 0.123 | 0.691 | 0.000 | ||
| 1 spectrum, QCVEEIER | 0.000 | 0.000 | 0.098 | 0.258 | 0.000 | 0.032 | 0.611 | 0.000 | ||
| 1 spectrum, AFVDNYGVAMETAEK | 0.000 | 0.000 | 0.157 | 0.000 | 0.312 | 0.000 | 0.530 | 0.000 |
| Plot | Lyso | Other | |||||||||||
| Expt C |
3 peptides |
5 spectra |
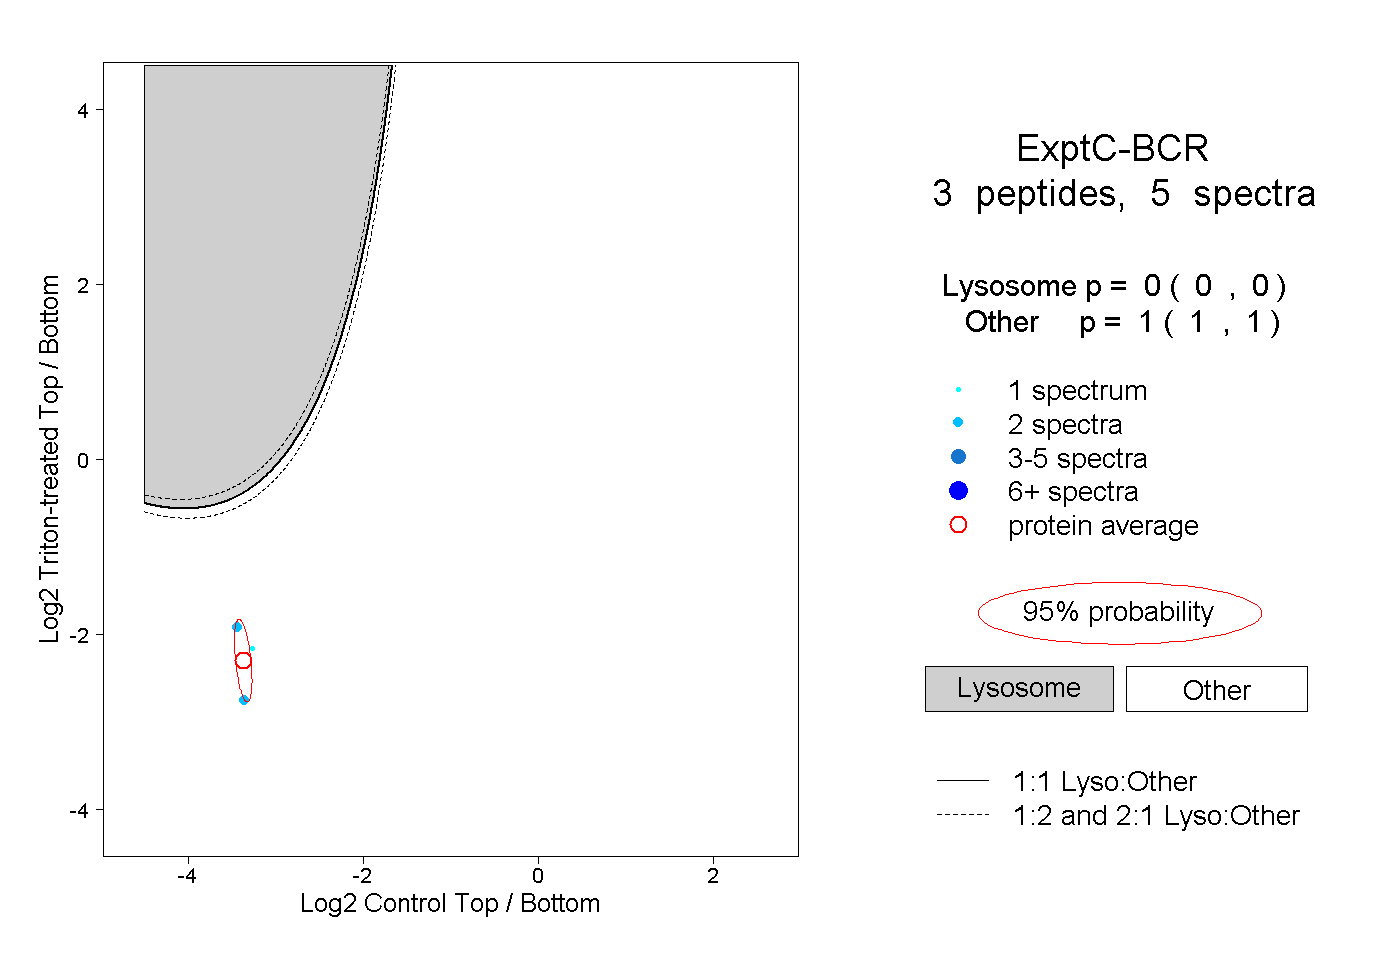 |
0.000 0.000 | 0.000 |
1.000 1.000 | 1.000 |